Get Indexology® Blog updates via email.

In This List

A Stalwart Delivers

Measuring Board Gender Diversity across S&P ESG Indices

Reversing the Entropy of Climate Change

Tip of the Iceberg: Fixed Income ETFs in Times of Crisis

Examining Equal Weight

A Stalwart Delivers

Contributor Image
Fei Mei Chan

Former Director, Core Product Management

S&P Dow Jones Indices

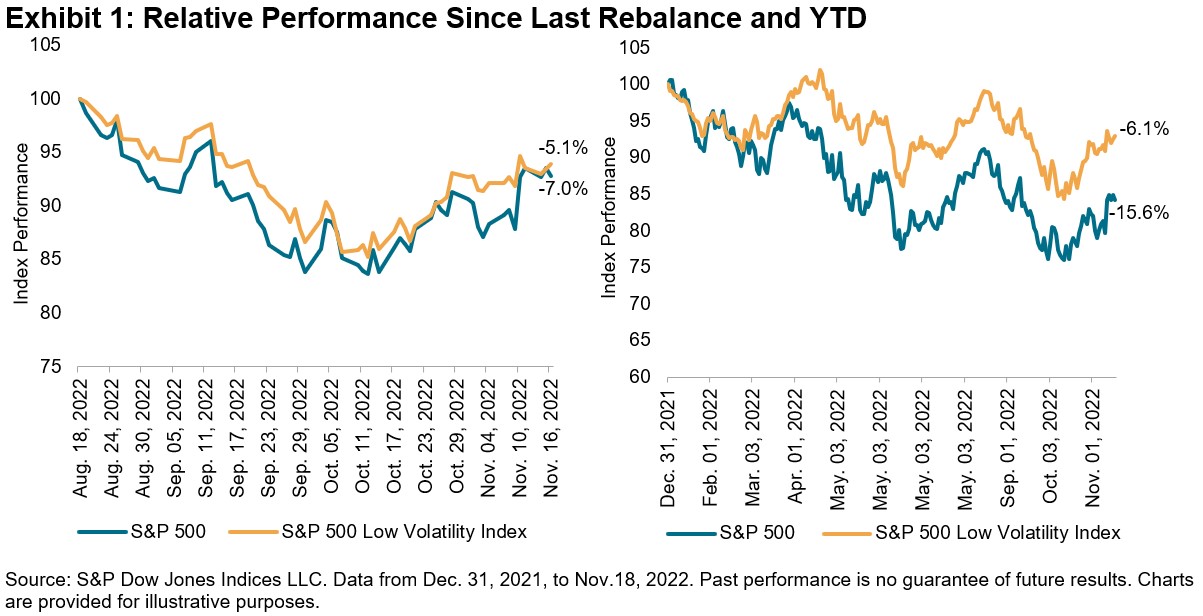
U.S. equities struggled again in the past three months. The last rebalance for the S&P 500® Low Volatility Index was in August 2022 and the S&P 500 has since declined 7.0%. The S&P 500 Low Volatility Index, which has historically moderated the performance of the benchmark, lost 5.1% in the same period.

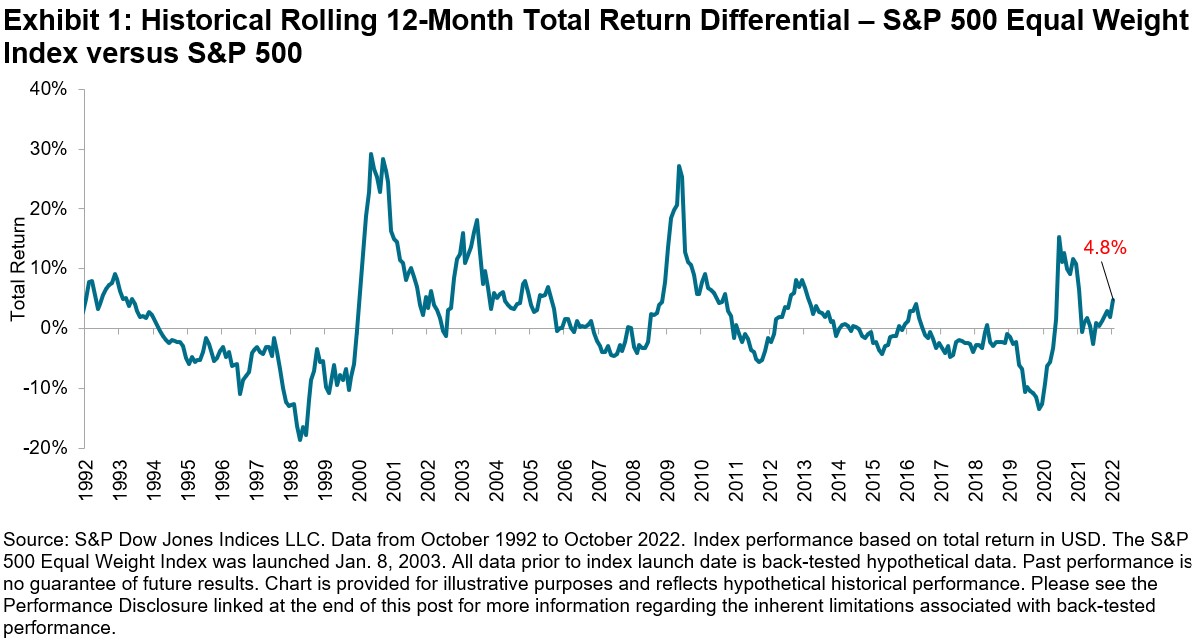
For the entirety of 2022 so far, Low Volatility’s outperformance was much more impressive, declining just 6.1% compared to a loss of 15.6% for the S&P 500. Delivering what the strategy aims at, the low volatility index achieved its 9.5% outperformance with a standard deviation of 18% versus 25% for the benchmark S&P 500.

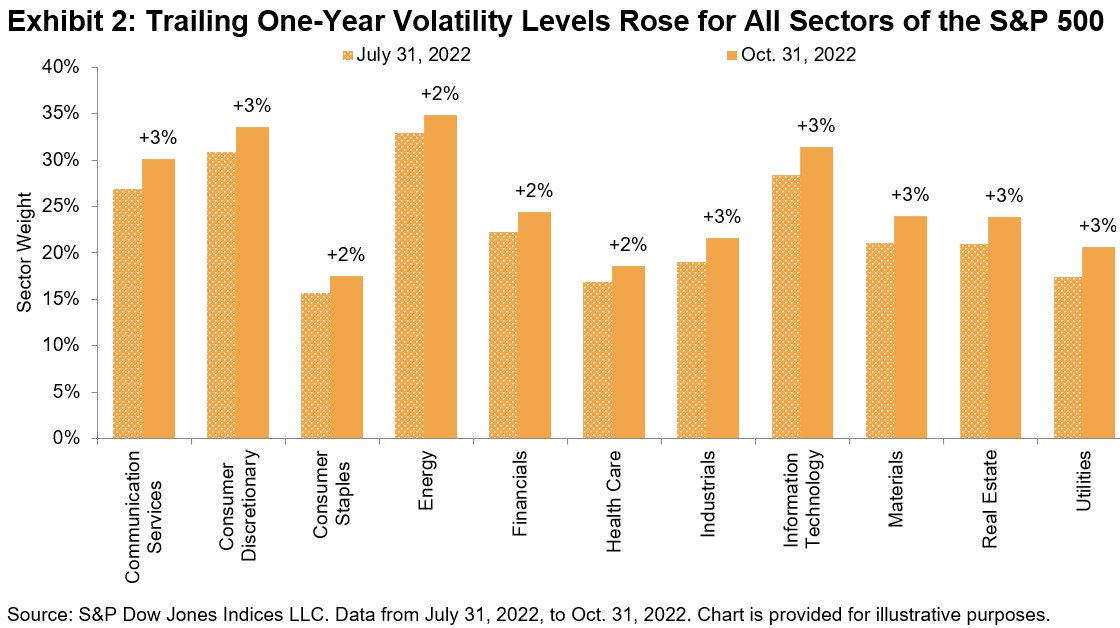
Since August, volatility has risen for all S&P 500 sectors, with Consumer Discretionary and Energy maintaining their status as the most volatile sectors.

The latest rebalance, effective after the market close on Nov. 18, 2022, yielded just minor shifts in allocation. The two sectors that reduced their presence most significantly in the index were Real Estate and Materials, while the index focused more on Industrials and Consumer Staples. While Utilities also lost some ground, it remains the largest sector in the index. Energy stocks, which disappeared from the index in May 2020, have yet to make a reappearance.


The posts on this blog are opinions, not advice. Please read our Disclaimers.

Measuring Board Gender Diversity across S&P ESG Indices

Contributor Image
Kieran Trevor

Analyst, ESG Research & Design, ESG Indices

S&P Dow Jones Indices

According to numerous studies,1 having a gender-diverse board is a key indicator of good corporate governance.2 The gender diversity of a board of an investee company is also one of the mandatory sustainability indicators3 that financial market participants are required to assess and report on under the EU’s Sustainable Finance Disclosure Regulation (SFDR).4 Using the S&P Global SFDR dataset,5 we examine this metric in the context of the S&P ESG Indices.

First, we observe how the proportion of women on boards varies across countries (see Exhibit 1). On average, French firms have the most gender-balanced boards. This is unsurprising, given that the French government enforces a minimum of 40% women on boards,6 a requirement that may follow across the EU.7 Meanwhile, all Qatari firms have an entirely male board.

In terms of sectors, firms operating in Energy, Consumer Staples, Information Technology and Health Care have a greater-than-average number of women on their boards, while Materials has the lowest average (see Exhibit 2).

However, sector- and country-level metrics do not tell the full story, and the distribution within regional indices can vary dramatically. Exhibit 3 shows the range of values of board gender diversity across a selected set of investable universes.

While most firms in our selected U.S. benchmarks have about 20%-40% women on the board, European firms tend to have between 30% and 50%, and firms in Korea and Mexico average far fewer women on the board. Canadian firms, meanwhile, have a comparatively tighter range of values than their developed counterparts, with all boards having at least one female member, but none exceeding 50%.

S&P ESG Indices

How could indices help those who are interested in companies with greater board gender diversity? Exhibit 4 illustrates the impact that the S&P DJI ESG Scores have within the S&P ESG Index Series to help improve the board gender diversity of constituents relative to the underlying index.

On average, for the majority of the indices studied here, the ESG version exhibited a greater percentage of women on the board than its benchmark, with only the Mexico- and Brazil-based indices as the exceptions.

S&P DJI ESG Scores

Board Gender Diversity forms a part of the Corporate Governance Score, a component of the broader S&P Governance and Economic Dimension Score—the “G” in the S&P DJI ESG Score,9 as reflected in Exhibit 5.

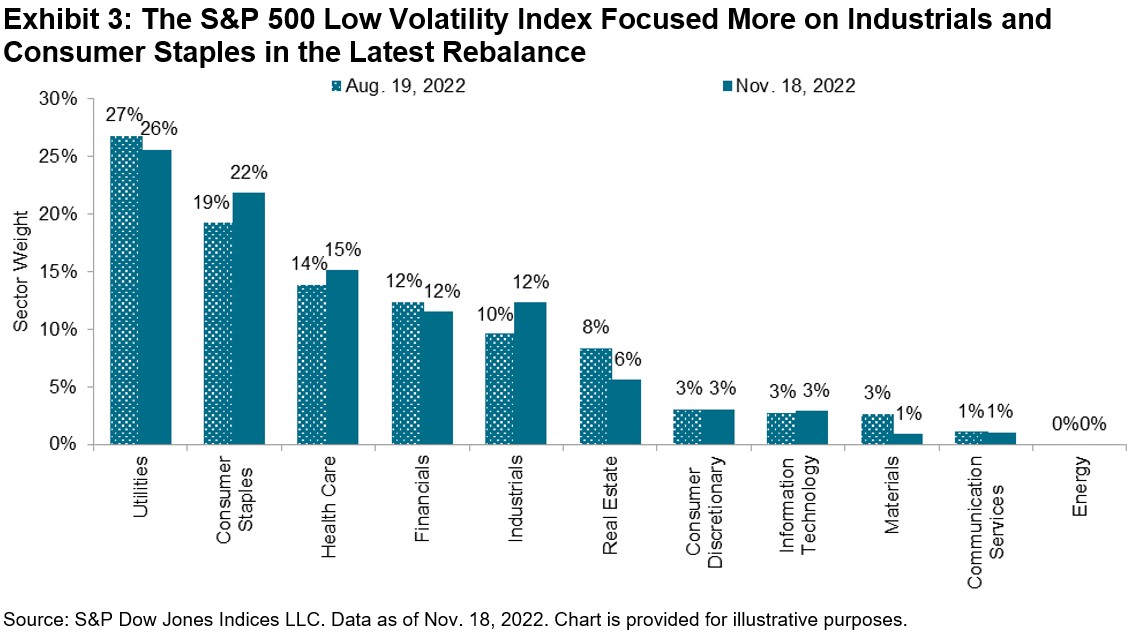
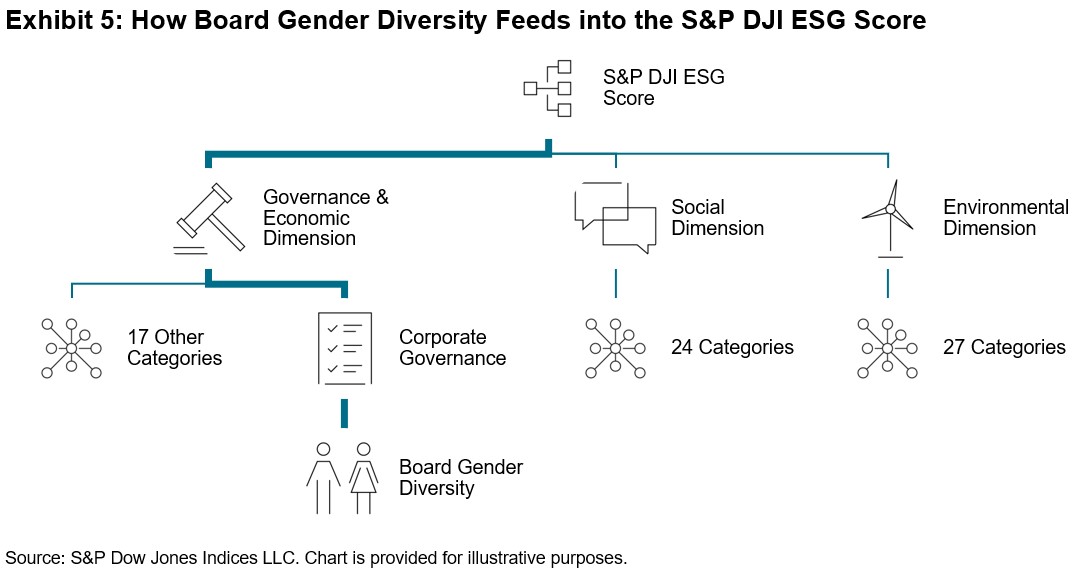
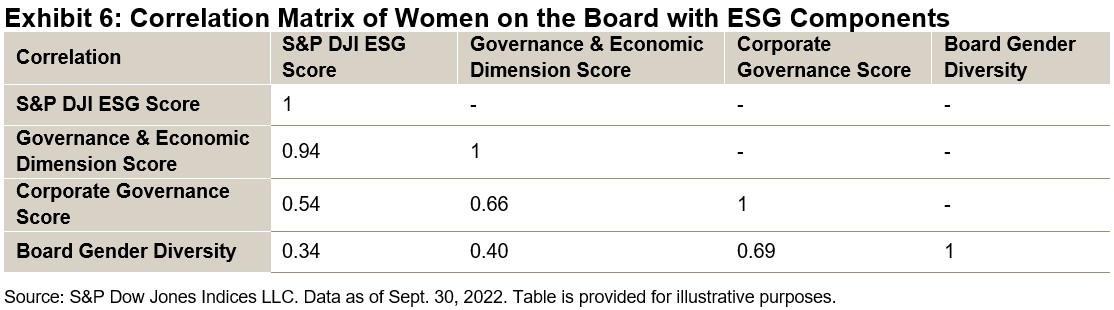
Exhibit 6 demonstrates the influence that women on boards of directors can have on each dimension of a firm’s S&P DJI ESG Score. Even at the overall ESG score level, board gender diversity still plays a part in a company’s overall sustainability rating.


1   FCA Report on the impact of diversity and inclusion in the workplace: https://www.fca.org.uk/publication/research/review-research-literature-evidence-impact-diversity-inclusion-workplace.pdf

2   The study “Corporate Governance, Board Diversity, and Firm Value” examined Fortune 1000 firms and found a significant positive relationship between the fraction of women or minorities on the board and firm value. Carter, David A., Simkins, Betty J. and Simpson, W. Gary, “Corporate Governance, Board Diversity, and Firm Performance,” March 2002.

3   Please refer to Commission Delegated Regulation (EU) 2022/1288 for a complete list of principal adverse impacts of investment decisions on sustainability factors. Financial market participants are required to disclose how they consider principal adverse impacts of their investment decisions on sustainability factors. Assessing principal adverse impacts of investment decisions on sustainability factors is also linked to the principle of “Do no significant harm.”

4   Regulation (EU) 2019/2088: https://eur-lex.europa.eu/legal-content/EN/TXT/PDF/?uri=CELEX:32019R2088&from=EN

5   Visit www.spglobal.com/ for more information.

6   French law proposal No.4000: https://www.assemblee-nationale.fr/dyn/15/textes/l15b4000_proposition-loi

7   Press release on an EU directive to strengthen gender equality on boards: https://presidence-francaise.consilium.europa.eu/en/news/member-states-adopt-a-general-approach-on-an-eu-directive-aiming-to-strengthen-gender-equality-on-corporate-boards/

8   The S&P ESG Index Series does not have an objective of selecting constituents with greater gender board diversity. However, board gender diversity is a component of the ESG scoring assessment.

9   For more information on the construction of our S&P DJI ESG Scores, please see the methodology https://www.spglobal.com/spdji/en/documents/methodologies/methodology-sp-dji-esg-score.pdf.

The posts on this blog are opinions, not advice. Please read our Disclaimers.

Reversing the Entropy of Climate Change

Contributor Image
Barbara Velado

Senior Analyst, Research & Design, Sustainability Indices

S&P Dow Jones Indices

According to the second law of thermodynamics, the state of disorder or chaos of a system, also known as entropy, increases over time, defining the so-called arrow of time. Applying this analogy to Earth, is the world headed into chaos as climate change unfolds? Not necessarily. Just as entropy can decrease if useful work is put into it—think of a freezer turning water to ice—so is the world able to prevent the worst impacts from climate change.1

Measuring Temperature Alignment

S&P Global Trucost models temperature alignment by translating past emissions and forward-looking targets into a common and intuitive metric, which not only measures companies’ historical emissions at a given point in time, but also takes their (de)carbonization trajectory into account.2

How does the transition pathway look globally? It doesn’t look bright, with few countries being aligned with below 2°C (e.g., Portugal and Germany) or below 1.5°C (e.g., Switzerland and Thailand). Most countries are lagging on the climate front, with a forward-looking pathway close to 3°C by 2100 (see Exhibit 1).

A common misconception is that low-carbon sectors are more prepared to meet the Paris Agreement’s goals of net-zero emissions by 2050. However, historical emissions and forward-looking transition pathway assessments are largely uncorrelated (see Exhibit 2). The Utilities sector provides an example: while its emissions are among the highest due to its operational nature, companies can still be well below their 1.5°C carbon budget.3 In fact, high carbon emitters can be well positioned to meet the Paris goals, where the decarbonization potential from the adoption of green technologies is highest.

From a sectoral lens, there is a wide dispersion of companies under or above their carbon budgets (see Exhibit 3). While companies below their 1.5°C carbon budget are aligned with the Paris Agreement, as companies get further above (right of dashed line), they are likely to be aligned with higher temperature scenarios. As the increasing density of horizontal scatter points indicates, aligned companies accounted for only 25% of the universe as of Sept. 30, 2022.4

How Hot or Cold Are S&P DJI Indices?

We aggregated index-level temperature assessment, focusing on climate indices (see Exhibit 4). Across universes assessed, market-cap benchmarks are incompatible with limiting warming by 2°C. Whereas excluding the fossil fuel complex (S&P Fossil Fuel Free Indices) reduces relative carbon intensity, that doesn’t necessarily translate into 1.5°C alignment. To align with net zero by 2050, index strategies must follow an absolute decarbonization approach, like the S&P PACTTM Indices (S&P Paris-Aligned & Climate Transition Indices).5 Additionally, the S&P PACT Indices incorporate forward-looking sectoral elements that make them well positioned to navigate the low-carbon transition.

Index temperature alignment offers a starting point for market participants to align their strategies with the Paris Agreement goals. While currently S&P DJI’s market-cap benchmarks fall short of meeting this target; the S&P PACT Indices, which incorporate transition pathway considerations, provide forward-looking alignment. Just as entropy can be reversed with the right inputs, indices can be used to help reduce the negative effects of climate change and align with the Paris Agreement goals of a better, less warm and more orderly future state.

1 According to IPCC’s Sixth Assessment Report, the worst effects of climate change can be prevented if global warming does not exceed 1.5°C above pre-industrial levels.

2 Analysis performed using Trucost’s Paris Alignment dataset.

3 Company’s 1.5°C carbon budget represents the allocated carbon emissions pathway to reach a 1.5°C scenario.

4 Based on the S&P Global BMI as of Sept. 30, 2022, by index weight.

5 The S&P PACT Indices follow a 7% year-over-year decarbonization trajectory, as mandated by the EU Benchmark Regulation.


The posts on this blog are opinions, not advice. Please read our Disclaimers.

Tip of the Iceberg: Fixed Income ETFs in Times of Crisis

Contributor Image
Joseph Nelesen

Senior Director, Index Investment Strategy

S&P Dow Jones Indices

20 and 15 years after the launches of the first ETFs based on the iBoxx USD Liquid Investment Grade (IG) Index and iBoxx USD Liquid High Yield (HY) Index, respectively, ETFs are increasingly used to trade fixed income without the necessity of transacting individual bonds. The tradability of bond ETFs has been leveraged by a growing number of investors as market stressors regularly emerge, and crises have long offered proving grounds for index-based products, including ETFs. If the recent U.K. market downturn reminds us of anything (beyond the surprising resilience of a head of lettuce), it is that liquidity can be hard to find when it’s needed. As the Financial Times recently reported, the aftermath is forcing institutions to take a hard look at how quickly they can sell assets in a crisis.

One might wonder how such situations play out around the world when more ETFs and other index products are used as potential sources of liquidity. Indeed, each market crisis since the Global Financial Crisis has tested the idea that index-based bond ETFs could provide a buffer to be traded before resorting to selling underlying bonds. As seen in Exhibit 1, increasing volumes for ETFs tracking the iBoxx USD Liquid IG Index and iBoxx USD Liquid HY Index during periods of stress over the past 15 years has demonstrated that such funds and their underlying benchmarks may be tools that react quickly during volatile markets.

The increasing usage of ETFs based on the iBoxx USD Liquid HY Index, for example, is facilitated by the index methodology that emphasizes holding the most-traded bonds. Applying higher minimums to issuer size and amount outstanding while also capping single issuers, the index filters the USD 1.5 trillion developed iBoxx USD Liquid HY Index benchmark universe down to just over USD 1 trillion in highly traded components. The resulting index has historically supported not only ETFs but also an expanding ecosystem of other tradable instruments. For example, in 2021 the volume of futures and total return swaps connected to the iBoxx USD Liquid HY Index was nearly five times the same index’s ETF AUM (see “Income in Indexing: How the iBoxx Liquidity Ecosystem Lends Well to Credit Markets – Part 2”). High fund volumes and assets appear to have supported the growth of ETF options, as well as securities lending and portfolio trading.

Beyond the cornerstone iBoxx USD Liquid IG and HY Indices underlying ETFs at the core of a fixed income strategy, the proliferation of fixed income ETFs over the past decade (see Exhibit 2) could allow for even more fine-tuning of liquid-beta sleeves that mirror broader portfolio characteristics while remaining tradable intraday, potentially reducing pressure on asset owners to use their carefully selected bonds as a source of capital in a crisis.

In the end, index design matters. Done right, a fixed income index has the potential to harness the most-traded segments of the bond universe and support liquid instruments.

The posts on this blog are opinions, not advice. Please read our Disclaimers.

Examining Equal Weight

Contributor Image
Anu Ganti

U.S. Head of Index Investment Strategy

S&P Dow Jones Indices

In this tumultuous market characterized by Fed rate hikes, elevated inflation and a strong dollar, mega-cap growth companies have suffered heavy losses, paced by recent “Big Tech” earnings disappointments from Meta, Microsoft, Alphabet, Amazon and others. The S&P 500® Top 50 declined by 19% over the past 12 months, underperforming the S&P 500 by 5%. The unsurprising result is that S&P 500 Equal Weight Index, which by definition is underweight these mega-cap names, has outperformed. Exhibit 1 shows that the equal weight index beat the S&P 500 by 5% in the 12-month period ending October 2022.

Exhibit 2 shows that the S&P 500 Equal Weight Index’s underweight to Communication Services and Information Technology, sectors that posted substantial losses so far this year, was a key contributor to the index’s recovery.

In addition to favorable sector exposures, the importance of which my colleague discusses here, the S&P 500 Equal Weight Index’s inherent factor tilts have proven beneficial as well. The strategy’s small-cap bias has been a tailwind, since smaller-cap companies, whose revenues are more domestically generated, have been less vulnerable to the macro headwind of a stronger U.S. dollar. Exhibit 3 illustrates the recent strong outperformance of the S&P 400® and the S&P 600® relative to their large-cap counterpart.

The S&P 500 Equal Weight Index’s anti-momentum bias, the product of selling relative winners and purchasing relative losers at each rebalance, has aided outperformance as a result of the momentum factor’s weakness for most of this year. The strategy’s implicit value bias has also been a source of outperformance, given the strong turnaround in the performance of value strategies this year.

A natural outcome of the outperformance of the S&P 500 Equal Weight Index is that concentration levels in the market have begun to decline, as we observe in Exhibit 4. This is not surprising given the inverse relationship between concentration and equal weighting.


The posts on this blog are opinions, not advice. Please read our Disclaimers.