Get Indexology® Blog updates via email.

In This List

Digital Asset Strategies – To Diversify, or Not?

The Climb: SPIVA South Africa Mid-Year 2022 Scorecard

Why Core Construction Matters

Examining Defensive Strategies Through an Index Lens

Refining the Quality Metrics

Digital Asset Strategies – To Diversify, or Not?

Contributor Image
Tyrone Ross

CEO & Cofounder

Turnqey Labs, Inc

This blog was co-authored by Tyrone Ross and Erik Smith.

Over the past 13 years, the cryptocurrency market has reached a cumulative market capitalization in the trillions. As of September 2022, Lukka Enterprise Data has listed 50 cryptocurrency assets with a market capitalization of over USD 1 billion. With an increasing number of investment options to choose from, many market participants are wondering:

  • Should digital asset portfolios be diversified?
  • Can diversification of cryptocurrency assets mitigate risk in a highly volatile asset class?

Generally speaking, financial advisors and investors tend to diversify broadly across asset classes and within asset classes. After all, actively picking investments is incredibly difficult. As Craig Lazzara, Managing Director and Global Head of Index Investment Strategy for S&P Dow Jones Indices, points out, “Returns are typically driven by a relatively small number of strong performers, which pull the index’s return above that of most of its constituents.” There are decades of historical performance data that support this observation in the equity markets. Does the same apply in the digital asset markets?

Let’s take a look at four S&P Digital Market Indices:

Looking at back-tested data, over the past five years (as of Sept. 30, 2022), the S&P Bitcoin Index and S&P Cryptocurrency MegaCap Index outperformed the broader cryptocurrency indices on an annualized risk-adjusted return basis. The S&P Cryptocurrency MegaCap Index, which combines Bitcoin and Ether into one index weighted by market capitalization, led the way in absolute returns, posting a 36.21% annualized five-year return. The S&P Bitcoin Index came in a close second on an absolute return basis, posting a 36.12% annualized five-year return. Similar to previous market downturns, Bitcoin has held up better than the vast majority of cryptocurrency assets in 2022.

However, over a three-year timeframe, Bitcoin lagged the more diversified crypto-asset indices in both absolute and risk-adjusted annualized returns. The S&P Cryptocurrency MegaCap Index, which includes Bitcoin and Ethereum, led the way during this timeframe (see Exhibit 2).

As we can see in Exhibit 3, Ethereum’s share of the total crypto-asset market cap has grown slightly since the beginning of 2017, now making up over 17% of the total digital asset market. Bitcoin’s market cap, which accounted for approximately 90% of the cryptocurrency market at the beginning of 2017, has fallen to around 39% dominance. This is still a high percentage compared to most asset classes.

So how could diversifying away from Bitcoin have affected portfolios? The data suggests diversifying would have resulted in higher absolute and risk-adjusted returns over the past three years, while underperforming Bitcoin over the past five years.

Closing Thoughts

As with any investment portfolio, timeframe, risk tolerance and risk capacity all play key roles. Similar to how investors had a difficult time gauging which technology companies would thrive following the internet boom in the 1990s, it is equally difficult to predict which cryptocurrencies will gain or lose market share in the future. With limited historical data to base our analysis on, we are left pondering what the future holds for this new asset class that is growing exponentially. The best way to make an informed decision on structuring a digital asset portfolio is to continuously learn about and evaluate this evolving market. Education comes first.

To learn more about the S&P Cryptocurrency Indices, please see https://www.spglobal.com/spdji/en/landing/investment-themes/sp-cryptocurrency-indices/.

The posts on this blog are opinions, not advice. Please read our Disclaimers.

The Climb: SPIVA South Africa Mid-Year 2022 Scorecard

Contributor Image
Joseph Nelesen

Senior Director, Index Investment Strategy

S&P Dow Jones Indices

A clever (yet ill-fated) character once said, “Chaos is a ladder.” The first half of 2022 was indeed full of chaos in many major markets, including South Africa; our latest SPIVA South Africa Scorecard for the region shows where the rungs were slippery and where active funds were able to climb the fastest.

Overall, the underperformance rate of actively managed South Africa equity funds over H1 2022 was well below recent full-year measures (see Exhibit 1), with nearly two-thirds outperforming the S&P South Africa 50.

Avoiding a small number of underperforming stocks had the potential to make a big difference. Within the S&P South Africa 50, 49% of stocks trailed the benchmark and 51% outperformed, but just a few stocks contributed the majority of the index’s -6.3% H1 performance. Luxury goods firm Compagnie Financiere Richemont S.A (CFR) and communications company MTN Group Ltd. (MTN) combined to account for two-thirds of the total index decline. As the largest weight in the index, and the second-worst performer over H1, CFR made the most significant impact on the benchmark’s returns (see Exhibit 2).

Returns were not distributed “normally,” creating an interesting challenge for stock pickers. The median S&P South Africa 50 stock return was -5.1% in H1, close to the index return, but the (unweighted) average stock return was 0.3%, due to the strong outperformance from a minority of large winners. Indeed, the outperformers averaged 23% excess return, while underperformers returned -11% on average. Even when excluding an outlier with more than 200% excess return during H1 (and a weight in the index of less than 1%), the average excess return of remaining outperformers was 16%. In other words: a manager’s chances of picking an underperforming or outperforming stock were nearly equal, but outperforming stocks were disproportionately rewarding to performance.

Based on the relative performance of the S&P South Africa 50 Equal Weight Index, tilting away from mega-cap names may have been one way for active managers to navigate a successful H1. The equal-weighted index outperformed the cap-weighted S&P South Africa 50 by 1.5% through H1, and in a perhaps positive sign for the full-year results, has continued to separate itself by an even wider margin since then (see Exhibit 4).

Reducing weights of the largest stocks in the benchmark remains a prevalent active management strategy, and one that may have benefited active managers in South Africa in the first half of 2022. So how did active managers do on a risk-adjusted basis? To find out, you’ll have to dive deeper into the SPIVA South Africa Mid-Year 2022 Scorecard. (Spoiler alert: some results are very different!)

The posts on this blog are opinions, not advice. Please read our Disclaimers.

Why Core Construction Matters

Look inside the S&P 1500 and its core components as S&P DJI’s Hamish Preston explores the performance of Equal Weight and sector indices, as well as highlighting how positive earnings can influence performance.

The posts on this blog are opinions, not advice. Please read our Disclaimers.

Examining Defensive Strategies Through an Index Lens

How are advisors using indices to evaluate defensive strategies as they look to protect client goals amid rising rates and inflation? Join TD Wealth’s Andrew Neatt and S&P DJI’s Julie Ballard for a closer look at the S&P 500 Dividend Aristocrats and S&P 500 Quality indices.

The posts on this blog are opinions, not advice. Please read our Disclaimers.

Refining the Quality Metrics

Contributor Image
Wenli Bill Hao

Director, Factors and Dividends Indices, Product Management and Development

S&P Dow Jones Indices

Introduction

High-quality companies have always been appealing to investors. In fact, quality equity investing was documented as early as 1949 by Benjamin Graham in his original publication of The Intelligent Investor.1

Despite a wide range of definitions for what constitutes a high-quality company, characteristics such as profitability, competitive position, earnings quality, corporate governance and modest debt levels seem to be common markers agreed upon by the investment community.

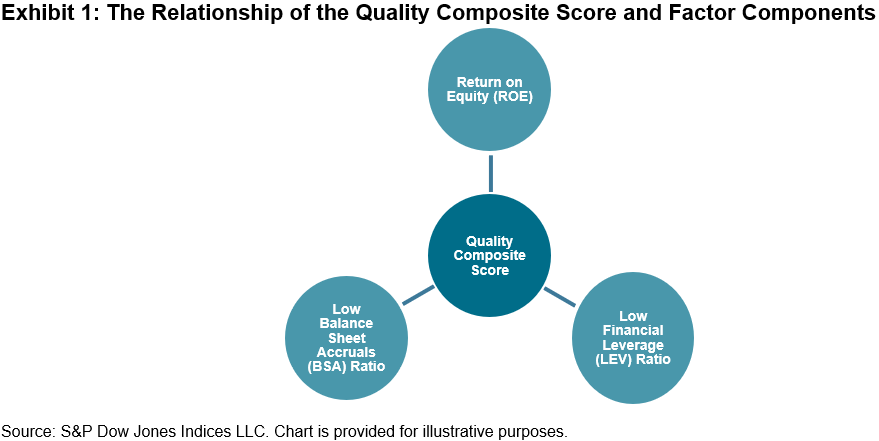
Currently, S&P Dow Jones Indices (S&P DJI) measures quality as a composite score of high profitability (ROE), low balance sheet accruals (BSA) and low financial leverage (LEV) (see Exhibit 1). A company’s overall quality score is the average of the z-scores of these three components.2

Refinement

To better align the computation of the quality factors with both industry and academic research practices, S&P DJI is implementing the following four changes after consulting with market participants.

  1. If the underlying earnings per share (EPS) or book value per share (BVPS) for a given stock’s ROE is negative, its ROE value will not be calculated, and the stock’s ROE z-score will be set equal to the lowest ROE z-score in the universe.
  2. If the underlying EPS or BVPS for a given stock’s ROE is negative, the quality score will be calculated, but it will be ineligible for index inclusion for the highest quintile (or equivalent) quality indices. For the S&P Quality, Value & Momentum Top 90% Multi-Factor Indices and S&P Quality – Lowest Quintile Indices, if the underlying EPS or BVPS for a given stock’s ROE is negative, the stock’s quality score will be calculated, and it will be eligible for index inclusion.
  3. The denominator of the accruals ratio calculation will use the average total assets rather than the average net operating assets.3
  4. For stocks classified in the Financials (GICS 40) or Real Estate (GICS 60) sectors, the accruals ratio calculation will not be applied. The ROE and LEV ratios will only be used to calculate a stock’s quality score.3

Rationale for Changes

The first change penalizes negative EPS or BVPS stocks by assigning them the lowest ROE z-scores in the universe, while the second change ensures that all constituents of the highest quality quintile have positive EPS and positive BVPS. Such requirements set higher standards for a stock to be included in the quality indices. The third change reduces the accruals ratio volatility and avoids negative values in the denominator. Lastly, the fourth change addresses the issue that the accruals ratio is not applicable to the Financials and Real Estate sectors. Importantly, these changes further align our factor metrics with industry and academic norms.

Potential Impacts of Changes

To help evaluate the potential impacts of the proposed changes, we built three hypothetical indices (Proposed S&P 500® Quality Index, Proposed S&P MidCap 400® Quality Index and Proposed S&P SmallCap 600® Quality Index), which incorporate the changes specified. We then compared the constituents of the current S&P 500 Quality Index, S&P 400® Quality Index and S&P 600® Quality Index with those of the corresponding proposed indices. The impacts are evaluated from the following aspects.

Names, Weights and Turnovers

The current quality indices and the corresponding proposed indices select the top 20% of stocks from the underlying universes (S&P 500, S&P 400 and S&P 600), resulting in 100, 80 and 120 constituents, respectively. The overlapping names were all above 71%, while the overlapping weights are all above 74% (see Exhibit 2).

Starting from the pre-rebalance of constituents in June 2022, the Proposed S&P 500 Quality Index had a slightly lower turnover than the current S&P 500 Quality Index. Conversely, the proposed S&P 400 and 600 Quality Indices had slightly higher turnovers than the current S&P 400 and 600 Quality Indices.

Sector Comparison

Exhibit 3 shows that the Proposed S&P Quality Indices had higher weights in the Information Technology, Consumer Discretionary, Industrials and Health Care sectors, while having a significantly lower weight in the Financials sector versus the current S&P Quality Indices.

Implementation

The proposed changes will be implemented during the regular index rebalance, starting with the September 2022 rebalancing period.

Importantly, the S&P Quality Indices Methodology, S&P Quality, Value & Momentum Multi-factor Indices Methodology, S&P Factor-Based Quintile Indices Methodology and other impacted methodologies will be updated to reflect these changes.


1 Ung, D., Luk, P. and Kang, X. “Quality: A Distinct Equity Factor?”, S&P Dow Jones Indices, 2014.

2 For further information about the factor definition, factor score calculation and index design, please see the S&P Quality Indices Methodology.

3 Sloan, R. Do Stock Prices Fully Reflect Information in Accruals and Cash Flows about Future Earnings? The Accounting Review, Vol. 71, No. 3. (July 1996), pp. 289-315.

The posts on this blog are opinions, not advice. Please read our Disclaimers.