Get Indexology® Blog updates via email.

In This List

Active Management: Naughty or Nice?

Be Careful What You Wish For

Did COP26 deliver?

Alpha, Omicron: Why?

Energy Markets Tumble in November

Active Management: Naughty or Nice?

Contributor Image
Craig Lazzara

Former Managing Director, Index Investment Strategy

S&P Dow Jones Indices

The history of active investment management is, for the most part, a history of failure and frustration. Most active managers underperform most of the time, and success in one period seems not to predict subsequent success. We have long argued that active underperformance is not coincidental—it happens for identifiable and understandable reasons, and is therefore likely to continue.

But—most of the time is not all of the time, and most active managers are not all active managers. Some market environments may be more conducive to relatively favorable (or, to be precise, relatively less unfavorable) active performance. As I write in mid-December, 2021 is far enough advanced for us to attempt some informed speculation about what SPIVA® will reveal when the final results are in.

There are both positive and negative signals about the prospects for active management:

  • One of the most consistent challenges for active managers arises because, in most years, most stocks in the S&P 500® underperform the index. Returns are typically driven by a relatively small number of strong performers, which pull the index’s return above that of most of its constituents. Through the end of November, this was precisely the situation in the S&P 500: the index was up 23%, versus a gain of only 19% for the median stock. Only 42% of index members outperformed through the first 11 months of the year. Needless to say, fewer outperformers make for more challenging stock selection.

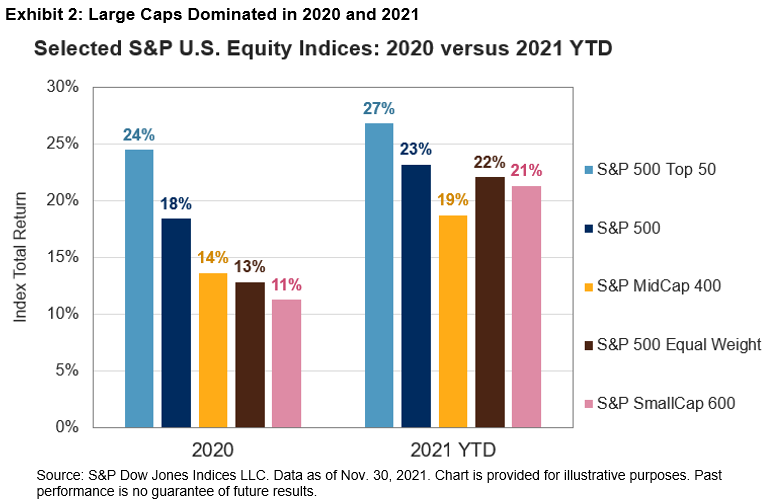
  • Strong markets historically have been somewhat more challenging for active managers; this is particularly true when the strong market is driven by some of the index’s largest names. Exhibit 2 shows us that the largest 50 stocks in the S&P 500 are comfortably in the lead for 2021. While it’s relatively difficult for active managers to overweight the largest names in their benchmark index, the reverse is not true. In fact we’ve found that large-cap managers tend to do better in periods when the superior performance of mid- or small-cap names gives them a chance to “cheat” (I use the term lovingly) down the cap scale. Not this year—although the performance of larger names may give mid- and small-cap managers an edge.


  • Dispersion began the year at a relatively modest level, but has recently begun a noticeable rise, closing November well into the top quartile of its historical range. Although dispersion tells us relatively little about the success of active managers as a group, heightened dispersion suggests that the range of active outcomes will be greater than usual. The best active performers should shine, as the value of stock selection skill rises when dispersion is high.

Readers can form their own opinions about the proper balance of these observations. Recognizing the hazard intrinsic to all predictions, my guess is that when we draw a line under 2021, active underperformance, at least for large-cap U.S. managers, will persist.

Of course, the conditions that make active management more or less difficult can change. If, e.g., 2022 sees a declining market, with megacaps and lower volatility names leading the way down, it’s conceivable that active underperformance could become less prevalent. That may be cold comfort to the active management community and its customers—but sometimes cold comfort is all the comfort there is.

The posts on this blog are opinions, not advice. Please read our Disclaimers.

Be Careful What You Wish For

Contributor Image
Fei Mei Chan

Former Director, Core Product Management

S&P Dow Jones Indices

The Canadian equity market has had an exceptional 2021. One of the distinctive quirks of low volatility indices is that their relative performance typically suffers when their absolute performance is at its best, a pattern that we saw again this year. The S&P/TSX Composite Index was up an impressive 22.0% YTD through Dec. 16, 2021. In this environment, the S&P/TSX Composite Low Volatility Index has done remarkably well, lagging the S&P/TSX Composite by only 2.6% for a 19.4% gain. A defensive strategy designed to offer protection in bad times will typically not outperform (or even keep pace) in great times. The S&P/TSX Composite Low Volatility Index has done a better job at keeping up in 2021, capturing 88% of the S&P/TSX Composite Index’s total return versus its historical average of 66% monthly upside capture.

Strong markets generally imply calm volatility levels, and Exhibit 1 shows that volatility declined in the last three months across all sectors of the S&P/TSX Composite Index.

In the latest rebalance for the S&P/TSX Composite Low Volatility Index, effective at the close of trading on Dec. 17, 2021, the biggest allocation shift came from the Industrials and Real Estate sectors; the former gave up 5% and the latter gained 4%. Exhibit 2 shows that Financials and Real Estate, each with a 26% weight, are currently the two biggest sectors of the low volatility index. Health Care, which had disappeared from the index a year ago, has reappeared with a 2% weighting.

The posts on this blog are opinions, not advice. Please read our Disclaimers.

Did COP26 deliver?

Contributor Image
Jaspreet Duhra

Managing Director, Global Head of Sustainability Indices

S&P Dow Jones Indices

This piece originally appeared on Risk.net.

The dust has now settled on the 2021 UN Climate Change Conference (COP26). Did the gathering of almost 200 nations succeed in putting us on a path towards limiting warming to 1.5°C?

COP26 concluded with the signing of the Glasgow Pact, which agreed to “keep 1.5°C alive.” Some of the agreements made include strengthening 2030 emissions reduction targets, annually revising these targets and a “phase-down” of coal.

However, post-COP26, many felt an air of deflation. Alok Sharma, president of COP26, said: “We’re all well aware that, collectively, our climate ambition and action to date have fallen short on the promises made in [the Paris Agreement on climate change].”

Some areas of concern

There was a lack of visible commitment and priority from some of the world’s largest polluters. Notably absent were national leaders from China and Russia, the largest and fifth-largest contributors, respectively, of national carbon dioxide emissions. However, China did issue a surprise declaration on Enhancing Climate Change Action in the 2020s in partnership with the US.

There is a legacy of failed pledges – most famously the unfulfilled pledge for $100 billion in climate finance for developing nations by 2020. It is therefore unsurprising that headline-grabbing pledges made in the first week of COP26 have been overshadowed by inevitable questions around whether they will be realized. Then there is the failure of some countries to commit to net zero by 2050. India’s commitment to reach net zero by 2070 was a notable announcement at COP26. A significant step, certainly, but 2070 net-zero commitments will not restrict warming to 1.5°C.

Reasons for optimism

There were many pledges and commitments made at COP26. In addition, COP26 provides a platform for smaller nations. Though the limelight focuses on high-profile politicians and the crucial pledges of large nations, the conference is an important forum to also hear the pleas of smaller nations that may produce little in terms of greenhouse gas emissions, but may face the negative consequences of climate change.

COP26 represents a great opportunity, not just for official delegates from nations to gather but also for the wider community to lobby for change. For example, the Fairtrade Foundation supported the participation of a delegation of farmers whose livelihoods are threatened by climate change. Local campaigners demanded climate action from politicians.

Climate change is climbing agendas, and this rise is facilitated by high-profile events such as COP26. Climate issues are now covered more comprehensively in the media and are better understood by the wider population, and there is broad support for the idea that action needs to be taken.

Many companies have, for some time, recognized their ESG responsibilities. It is positive to see segments of the private sector demonstrating an understanding of the risks and opportunities specifically regarding climate change and committing to net zero by 2050. During COP26 there was a notable announcement through the Glasgow Financial Alliance for Net Zero (GFANZ) to commit more than $130 trillion of private capital to transform the economy to align with net zero.

What does this mean for indices?

As a provider of climate benchmarks, we closely follow developments at all UN Climate Change Conferences and evolving investor requirements. Increased demand from asset owners and commitments made by asset managers to account for climate change in their portfolios result in more interest surrounding net-zero-aligned indices.

The S&P PACT indices (S&P Paris-Aligned & Climate Transition Indices) are 1.5°C-aligned and available in several regional exposures, with the S&P UK Net Zero 2050 Paris-Aligned ESG Index being the most recent addition.

S&P DJI is committed to providing transparency on the methodology of its indices and regularly discloses how the sustainability objectives of its S&P PACT Indices are met.

Time will tell if COP26 will be remembered as a success. In the meantime, S&P DJI will continue to produce rules-based indices that align with a 1.5°C scenario to help investors on the path to net zero.

The posts on this blog are opinions, not advice. Please read our Disclaimers.

Alpha, Omicron: Why?

Contributor Image
Craig Lazzara

Former Managing Director, Index Investment Strategy

S&P Dow Jones Indices

Over the past week, global financial markets have been roiled by the discovery of the “Omicron” COVID-19 mutation. It’s far too soon to know how much this new variant will impact the world’s economy—but its discovery suggests an interesting thought experiment in, of all things, corporate governance.

The experiment is this: suppose Omicron turns out to be very dangerous and leads to a series of draconian economic shutdowns. Suppose further that a pharmaceutical manufacturer “X” comes up with a miracle cure—a vaccine that’s easy to administer and 100% effective. How should X’s shareholders want X to price its vaccine? How, in other words, should X’s real-world invention produce financial “alpha” for its owners?

The answer depends on the nature of X’s shareholder base. Suppose that X is included in most major stock market indices, so that a large fraction of its shares are held by index funds. Then many of X’s stockholders are “universal owners”—they own not just X but many of X’s competitors, customers, and suppliers. The growth of indexing has attracted considerable commentary, not all of it favorable, but in the case of X’s Omicron vaccine, the impact of universal owners should be entirely benign.

Why? From a narrow perspective, X should charge quite a lot for its vaccine, since it’s obviously worth a great deal. But from a universal owner’s perspective, X should give the stuff away (or at least sell it for marginal variable cost, which would be close to the same thing). X might well lose money, but an effective and plentiful vaccine would arguably cause the whole market to move upward sharply. Index funds would profit far more from the beta effect on their portfolios than from the alpha on a single stock.

Notice three things:

  • This argument is not altruistic. It may well be “socially responsible” for X to give the vaccine away, but that’s not why universal owners are putatively for it. The argument that they should disregard X’s profitability to boost the world’s stock markets is entirely self-interested.
  • Sufficiently diversified active managers have the same incentives as index funds. A given active manager might have an overweight in X, but it probably wouldn’t be big enough to negate the advantage of a general bull market.
  • The relevant balance of control at X is not the percentage ownership of individuals versus institutions or even of active managers versus index funds. The most important distinction is between the relative ownership of universal versus undiversified owners. “Undiversified” is a broad and relative term, of course, but might include concentrated “high conviction” active managers and hedge funds. And the most obvious group of undiversified shareholders, interestingly, is the management of the corporation itself.

For a universal owner, things that make the market rise are beneficial. This tautology has important implications for corporate governance and stewardship. And it means that, at least in some cases, rewards should come from beta, not from alpha.

The posts on this blog are opinions, not advice. Please read our Disclaimers.

Energy Markets Tumble in November

Contributor Image
Fiona Boal

Managing Director, Global Head of Equities

S&P Dow Jones Indices

The S&P GSCI, the broad commodities benchmark, declined 10.8% over the month. The poor performance was driven almost exclusively by a major correction in energy prices, as the discovery of the Omicron COVID-19 variant cast a lengthening shadow over demand growth, added further complications to global supply chains, and dampened economic growth forecasts. The release of emergency oil stocks also played into the mix.

The U.S. and other large oil-consuming nations agreed to release emergency oil stocks during the month, a sign of the growing concern among policy makers of rising gasoline prices and the contribution of energy prices to escalating levels of inflation. The coordination came after the Biden administration failed to convince oil producers, including Saudi Arabia and Russia, to produce more oil to meet demand as the world recovers from the pandemic. China has yet to detail its reserve release. News of the release coupled with the emergence of the Omicron COVID-19 variant sent energy prices on a downward spiral over the closing days of the November. The S&P GSCI Petroleum fell 17.7%, while the S&P GSCI Natural Gas declined 17.3%.

Given the turmoil in the energy complex, it was surprising that the other industrial commodities sector, industrial metals, did not fall more steeply in November. The S&P GSCI Industrial Metals fell 2.0%, with the S&P GSCI Zinc suffering the biggest monthly decline, down 5.8% after hitting a 14-year high in October. The worst of the power-related disruption to Chinese refined zinc supply appear to have been resolved, and Chinese demand for zinc has waned.

The S&P GSCI Gold was flat for the month as caution picked up across financial markets, but the U.S. dollar hit a new one-year high. The biggest move came from the S&P GSCI Silver, which fell 4.9%, more in line with the industrial metals space. About one-half of silver demand is industrial in nature.

Within agriculture, while most commodities fell a few percentage points in sympathy with energy, there were two notable outperformers that helped to bring the S&P GSCI Agriculture to nearly flat for the month (down 0.8%). The S&P GSCI Kansas Wheat continued its run from October, moving higher by another 4.4%. The export duty imposed by Russia continued to keep the global wheat market tight. Egypt, the world’s largest importer of wheat, made its biggest single purchase since 2008, buying 600,000 metric ton. The S&P GSCI Coffee was the best performer in the agriculture complex for the month, rallying 12.4%, and it gained 68.2% YTD. Coffee prices hit a 10-year high in November when a perfect brew of catalysts came together. In South America, drought followed by frosts affected the crop, while freight disruptions continued to play a role, as coffee is typically refined in countries outside of the crop’s origin.

The S&P GSCI Livestock bounced back by 2.7% in November. Cattle prices led the way, as demand was strong and outpaced increased supplies. Beef cow slaughter was 9% higher year-over-year in the U.S.

The posts on this blog are opinions, not advice. Please read our Disclaimers.