Get Indexology® Blog updates via email.

In This List

The Power of Style

SPIVA Institutional and the Pharaohs of Finance

Tucking in to the SPIVA Australia Mid-Year 2022 Scorecard

Net Zero: Time Is of the Essence

Commodities Take a Break over the Northern Hemisphere Summer

The Power of Style

Contributor Image
Craig Lazzara

Former Managing Director, Index Investment Strategy

S&P Dow Jones Indices

At some risk of oversimplification, the 16.1% decline in the S&P 500® for the first eight months of 2022 can be divided into three intervals, as the market fell by 20.0% through June, rallied in July, and then resumed its decline in August. This story, of course, is still evolving: for all we now know, the market might continue to decline, penetrating its June lows. Alternatively, we might already be in the early stages of the next bull market. Some things, these among them, are knowable only well after the fact.

Exhibit 1 shows this year’s pattern of returns for the S&P 500, as well as for its Growth and Value components. When the market declined, Value outperformed, while Growth was the better-performing style in July’s rally. Neither of these behaviors is particularly surprising. Growth typically outperforms when the market rises, and Value when the market falls (although Value’s defensive credentials are much less impressive than those of such stalwarts as Low Volatility or Dividend Aristocrats®).

Although the direction of the style indices’ performance is unsurprising, the magnitude of the spread between their returns was remarkably large, as Exhibit 2 shows.

Taken over all six-month intervals in the history of our style indices, the 16.2% spread between Value and Growth in the first six months of the year was at the 97th percentile. The tables turned in July, as the spread was at the opposite extreme of all one-month intervals. Results in August looked like those from the first six months. (If we calibrate the Value-Growth spread in dispersion units, the results are even more extreme.)

Given the size of the spreads (both positive and negative) between Value and Growth indices, it’s reasonable to ask what impact value and growth scores had on the performance of other factors. We regularly score every stock in our database, and we therefore can compute aggregate value and growth scores for our most prominent factor indices. Exhibit 3 shows, for the first six months of 2022, the relationship between each factor index’s relative performance and the difference between its value and growth scores. Given the size of the Value-Growth spread in the first six months, the upward slope in Exhibit 3 is unsurprising.

Exhibit 4 shows that the relationship ran in the opposite direction in July, whereas in August we again see a strong upward-sloping relationship. The predictive power in both cases is impressive for a single month.

We said earlier that it was too soon to say whether the bear market that began in January was over or merely quiescent, and the same is true about the influence of style on returns. What seems reasonable to say is that if the differential performance of Value and Growth indices remains wide, the influence of style on other factors is likely to continue.

The posts on this blog are opinions, not advice. Please read our Disclaimers.

SPIVA Institutional and the Pharaohs of Finance

Contributor Image
Tim Edwards

Managing Director, Index Investment Strategy

S&P Dow Jones Indices

Ptolemy I (367 BC-282 BC), one-time companion of Alexander the Great and later pharaoh of Egypt, has an important role in intellectual history. Among other contributions, he is credited with founding the library at Alexandria, one of the seven wonders of the ancient world, and for personally sponsoring the work of Euclid, a mathematician whose Elements reigned for over 2,000 years as the definitive work on geometry. According to legend, Ptolemy found the textbook too complicated and requested an easier path to understanding, to which Euclid responded, “There is no royal road to geometry.”

S&P DJI’s regular SPIVA® Scorecards show that relatively few actively managed mutual funds deliver long-term outperformance, particularly in the equity markets and especially in large-cap U.S. equities. The implications of this result remain hotly disputed, especially by active managers. A common objection is that, at least for some princes, an easier path is available. A Ptolemaic fund selector would not simply make a random choice from all the funds available, instead sorting the wheat from the chaff by a robust selection process. Nor would they pay the fees typical of an average investor, instead benefiting from direct access, economies of scale and sharp negotiations.

The latest edition of the SPIVA Institutional Scorecard offers perspective on these topics, extending the data of the “classic” 2021 U.S. Scorecard to include the performance of institutional accounts and gross-of-fees performance. For an investor seeking to select outperforming funds, such data should be of particular interest; they reflect the chances of investors who are sufficiently resourced to conduct a careful search and a vigorous negotiation.

Exhibit 1 plots the 10-year underperformance rates reported in the Institutional Scorecard for 21 international and domestic U.S. equity categories for mutual funds (on the y axis) and institutional accounts (on the x axis), with gross- and net-of-fees underperformance rates represented by dots and triangles, respectively. The dark grey diagonal highlights an equal underperformance rate within both institutional accounts and mutual funds, and the two data points corresponding to the U.S. Large-Cap Equity category are highlighted for interest.

The chart illustrates several facts of increasing importance. First: the dots fall generally lower and to the left of the triangles, but not by much. In other words, gross-of-fee performance was better, but not by enough to change the overall conclusion. Second, most of the data points are above the diagonal line, implying generally higher underperformance rates among mutual funds than among institutional accounts, both before and after fees. Third, most of the data points are still quite close to the diagonal, implying that mutual fund and institutional account underperformance rates were broadly similar, no matter the equity category.

Finally, and most importantly, nearly all the data points in Exhibit 1 are in the top right quadrant. In other words, in most categories, more than 50% of actively managed mutual funds underperformed and more than 50% of actively managed institutional accounts underperformed. A careful search for a skilled manager and paying close attention to costs might improve the odds, but the long-term data suggest that even for the pharaohs of finance, there is no royal road to outperformance. 

The posts on this blog are opinions, not advice. Please read our Disclaimers.

Tucking in to the SPIVA Australia Mid-Year 2022 Scorecard

Contributor Image
Benedek Vörös

Director, Index Investment Strategy

S&P Dow Jones Indices

The semiannual S&P Indices Versus Active (SPIVA®) Scorecard1 measures the performance of actively managed funds against their corresponding benchmarks in various markets around the world. The latest Australian edition, the SPIVA Australia Mid-Year 2022 Scorecard, provides a number of interesting insights about the performance of active versus passive across active fund categories.

Although the long-term performance statistics remain grim reading for fund selectors, the first half of 2022 contained some bright spots for active managers: a slim majority of active Australian Equity General funds outperformed the S&P/ASX 200 in H1 2022. Ranging over time horizons and fund categories, we can see marked differences in the track records. Of active Australian international equity funds, 95% underperformed over the 15-year horizon, while domestic mid- and small-cap managers had greater success, with just over one-half of them underperforming the S&P/ASX Mid-Small over the same period. Large-cap domestic active managers landed in between, with 83% of active managers underperforming the S&P/ASX 200 in the past 15 years.

Digging deeper, underperforming funds tend to suffer withdrawals, which can lead to the affected funds’ eventual demise. Exhibit 2 shows survivorship rates of actively managed Australian funds across all categories over time. There is a strong downward-sloping trend, and in general, there was little divergence in the patterns of the decline of various fund categories; survivorship rates declined moving in near-lockstep across the board.

As Exhibit 3 shows, survivorship interacted with outperformance. In the Australian Equity Mid- and Small-Cap fund category, the majority of surviving funds outperformed the S&P/ASX Mid-Small, and even in the Australian large-cap segment, over one-third of surviving funds outperformed the S&P/ASX 200. However, the laws of natural selection did not seemingly apply to International Equity General funds, with almost 90% of surviving funds underperforming the S&P Developed Ex-Australia LargeMidCap.

Why might we see such differences between international and domestic equities? One reason may be that investors are more familiar with domestic than international performance standards; it may be easier for an Australian investor to judge the performance of domestic funds compared to international ones. This is not an issue limited to finance—they may also be better at judging surf than snow; they might also enthusiastically demolish a pizza that would bring a Neapolitan to tears.

While it can be challenging for a local investor to assess the performance of active managers, the semi-annual SPIVA Australia Scorecard brings transparent and objective assessments of international and domestic active fund performance, using industry-standard benchmarks that are recognized around the world. You can access the latest report here.

1See SPIVA Scorecards: An Overview. https://www.spglobal.com/spdji/en/education/article/spiva-scorecards-an-overview

The posts on this blog are opinions, not advice. Please read our Disclaimers.

Net Zero: Time Is of the Essence

Contributor Image
Reid Steadman

Former Managing Director, Global Head of ESG & Innovation

S&P Dow Jones Indices

This blog was co-authored by Reid Steadman and Fred Samama.

At Glasgow’s COP26, banks, insurers and investors representing USD 130 trillion in private capital made a historic commitment through the Glasgow Financial Alliance for Net Zero (GFANZ) to achieve net zero emissions by 2050 at the latest,1 mirroring government pledges.

The question remains how to integrate these commitments into a simple, transparent solution with limited impacts on portfolio construction and in line with investors’ needs to attain both a climate and investment objective.

Inspired by the same paper GFANZ has recently recommended for tackling this problem,* S&P Dow Jones Indices (S&P DJI) has launched the S&P Net Zero 2050 Carbon Budget Indices, a series of benchmarks that reflects net zero alignment in a simple and innovative way. This series complements the S&P PACT™ Indices (S&P Paris-Aligned & Climate Transition Indices). Unlike the S&P PACT Indices, this series was developed with a sole focus on aligning with the specific net zero assessments published by the Intergovernmental Panel on Climate Change (IPCC) on achievement of the Paris Agreement and does not align with the strictures of the European Union benchmark regulations for the use of the label EU Paris-aligned benchmark, which requires a specific decarbonization trajectory and other elements of ESG such as governance standards and business involvement screens.

Our methodology is simple and based on the following principle: the same approach for reducing greenhouse gas emissions for the planet can also be applied to all forms of diversified financing.

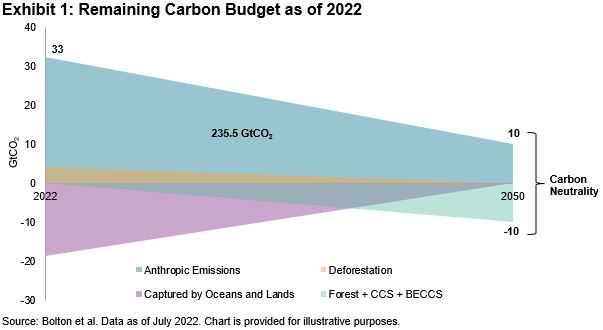
In other words, all types of financing, including equity, debt and other securities that compose benchmarks, can collectively reflect—as well as support or detract from—progress toward the goal to remain within a global carbon budget that would keep global warming at or below 1.5°C with an 83% probability (according to a 300 GtCO2 budget with a starting point of 31.5 GtCO2 in 2020).

The S&P Net Zero 2050 Carbon Budget Index Series, a series of broad benchmarks reflecting a diversified portfolio, aligns with the IPCC approach by allocating a carbon budget across index constituents based on their total emissions, defined by Scopes 1, 2 and 3 emissions calculated by S&P Global Trucost. The sum of the yearly carbon budgets will mirror the trajectory necessary to be carbon neutral, given the current year and the decarbonization required considering these variables. In the case of the initial “2022 Vintage” in this index series, an approximately 10% annual reduction will be required after a 25% initial haircut to align with net zero by 2050. We anticipate releasing other vintages of indices that will target a net zero outcome based on the carbon budgets and years to 2050 at launch.

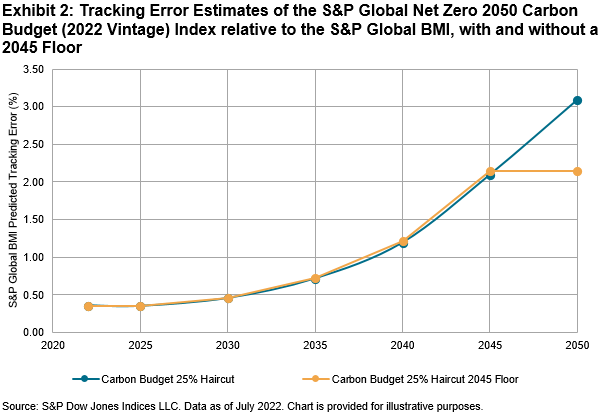
Furthermore, the approach has limited index construction impacts, as illustrated by a low tracking error to general equity markets. For instance, the S&P Global Net Zero 2050 Carbon Budget (2022 Vintage) Index had a tracking error of 0.36% at launch in 2022, which is anticipated to rise to 2.10% in 2045 and 3.09% in 2050.2

The tracking error, which is projected to rise closer to 2050, can be further mitigated by imposing a carbon reduction floor near 2045. By this time, the index is projected to be over 90% decarbonized and the tradeoff between further reductions in emissions and higher tracking error may not make sense for certain investors.

Finally, with industry neutrality targeted within the methodology, weight is reallocated within each industry toward the lowest carbon emitters, creating competition among peers toward reducing emissions toward 2050, for the benefit of the planet.

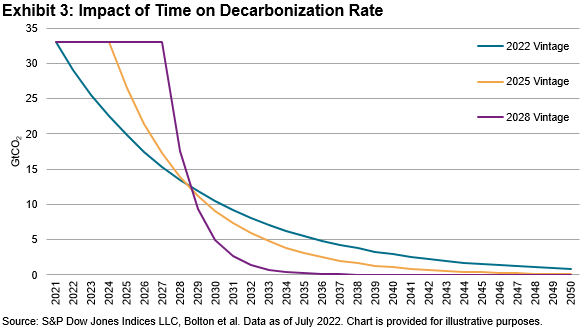
But time is of the essence. If being carbon neutral in 2022 means reducing the volume of CO2 by 12% per year (without an initial 25% haircut), this would become 20% in 2025 and impossible by the end of the decade, based on the current levels of emissions.

In conclusion, S&P DJI has applied the approach of the IPCC to keep global warming at or below 1.5°C with an 83% probability in a clear and transparent manner, with limited impacts on portfolio construction, with the aim of helping companies live by their historic GFANZ commitments for the benefit of financial markets and the planet.

*GFANZ recently highlighted the decarbonization approach (which is central to the S&P Net Zero Carbon Budget Indices methodology) in its publication “Measuring Portfolio Alignment” (see page 10). This is available at www.gfanzero.com. This publication refers to a paper by Bolton, P., Kacpercyzk, M., Samama, F., “Net-zero carbon portfolio alignment”, Financial Analysts Journal, Volume 82, Issue 2, 2022.

1 “Companies managing private capital totaling $130tn set commitments aligning with the goals of the Glasgow Financial Alliance for Net Zero,” https://www.gfanzero.com/press/amount-of-finance-committed-to-achieving-1-5c-now-at-scale-needed-to-deliver-the-transition/

2 The simulations assume constant emissions from companies, constant variances of risk factors, constant covariances between risk factors and constant index constituents.

The posts on this blog are opinions, not advice. Please read our Disclaimers.

Commodities Take a Break over the Northern Hemisphere Summer

Contributor Image
Fiona Boal

Managing Director, Global Head of Equities

S&P Dow Jones Indices

The S&P GSCI fell 2.7% in August; renewed strength in agricultural commodities and the continued rally in natural gas were not sufficient to overcome a late-month decline in oil prices. After eight months, the benchmark commodities index is 32% higher YTD, defying higher interest rates and growing fears of a prolonged global economic slowdown.

The global energy sector remains rattled by the precarious position of the European power market. S&P GSCI German Power (Yearly) rallied 59.4% over the month, but it was 41.5% off its intra-month high, reflecting the realities of a physical market that is trying to wean itself off a feedstock (Russian natural gas) in a matter of months despite an original dependence that took decades to foster. Short-term alternatives such as coal and nuclear are unpalatable to many. Germany is scheduled to cease nuclear energy production at the end of the year. Government intervention looks likely to continue to direct and influence these markets.

In the petroleum complex, a relatively tight global supply picture competed with fears of an economic slowdown, a strong U.S. dollar and the likelihood of government intervention to address skyrocketing retail energy prices. Additionally, a drop in financial market participation in the major oil derivative markets has contributed to higher levels of volatility. The S&P GSCI Petroleum fell 6.0% over the month. Negotiations between the West and Iran on a nuclear pact are ongoing. It is not clear how quickly Iranian oil could flow into the global market if and when an agreement is reached. OPEC+ publicly mulled the prospect of output cuts late in the month to support prices even though the cartel is failing to pump anything close to its current targets.

Within industrial metals, the S&P GSCI Iron Ore and S&P GSCI Nickel both fell by sizeable amounts, 12.2% and 9.4%, respectively. These two metals are very important to the Chinese economy, and the price drops reflect the continued drop in August economic activity, with the latest purchasing manager’s index still in contractionary territory below 50. Rising cases of COVID-19 across all 31 mainland Chinese provinces continued to be an issue.

With the U.S. dollar breaking through to another 20-year high in August, gold prices continued their fall this quarter. The S&P GSCI Gold fell 2.9% after falling in July. This year, gold has not performed as it historically has in inflationary or risk-off environments. The S&P GSCI Silver fell 11.9% following the drops in industrial metals.

The S&P GSCI Grains rose 3.5%, with the S&P GSCI Corn rising 9.3%. Declining U.S. and European corn crop prospects helped prices increase with the lower supply. Cotton had its best monthly performance in more than a decade, with the S&P GSCI Cotton rallying 17.3%. The August USDA Crop Report made significant reductions to U.S. and global cotton supply estimates, and flooding in Pakistan in the later part of the month is expected to further affect global supplies of the natural fiber. The S&P GSCI Livestock fell 1.5% in August.

The posts on this blog are opinions, not advice. Please read our Disclaimers.