Get Indexology® Blog updates via email.

In This List

Commodities Rise 36% in 2022 after a Flat July

Schrödinger’s Carbon: Intensity and Paris Alignment

What Fixed Income Index Liquidity Means for Insurers

Steep Declines for Islamic Benchmarks in Q2, Lagging Conventional Indices YTD

A Risk Control Approach to Cryptocurrencies: A Tool for a Crypto Winter

Commodities Rise 36% in 2022 after a Flat July

Contributor Image
Jim Wiederhold

Former Director, Commodities and Real Assets

S&P Dow Jones Indices

The S&P GSCI remained flat in July, holding on to a 36% YTD gain despite the bearish sentiment permeating the broad financial markets. This benchmark for world commodities has proven its merit during extremely hot inflation. The Fed hiked interest rates another 75 bps to fight inflation late in the month, but several factors across commodity sectors kept prices sticky in July.

Energy was mixed, as most petroleum commodities continued to come off their highs from earlier in the year. U.S. crude oil exports hit an all-time high on the back of overseas demand due to the big discount for WTI crude oil compared to Brent crude. The S&P GSCI Petroleum fell 3.0% while holding on to a still very strong 59.5% YTD gain. Natural gas, on the other hand, spiked higher to levels not seen since 2008 due to extreme temperatures around the globe requiring extra energy to cool buildings coinciding with Russia’s continued tightening of energy supplies to the EU. The S&P GSCI Natural Gas rose an impressive 54.4% in July, taking its lead from the extreme natural gas prices seen across the Continent. Late in the month, the EU agreed on a plan to ration natural gas use over the winter, just as Russia cut natural gas flows on the major pipeline from Russia to Germany to just 20% of capacity. French power prices rose to a new record high in July after a record low nuclear power generation recently.

With the pessimistic views on the deterioration of the global economy, The S&P GSCI Industrial Metals was flat last month. The S&P GSCI Copper was down 3.9%, but there are signs stabilization may be starting to sprout. A major rating agency in Shanghai came out with a report saying that it sees a V-shaped recovery, as China’s retail sales were up 22% year-over-year in June and passenger vehicle exports grew 40% year-over-year for the second quarter of 2022.

Reports of a deal between Russia and Ukraine that would allow grain to leave the Black Sea helped ease the supply concerns rampant within the agricultural space in July. Prices were also pressured by the upcoming northern hemisphere harvest and the consensus that yields in the U.S. will be similar to last year or better. The S&P GSCI Grains ended the month down 3.4%.

The S&P GSCI Precious Metals broke lower by 2.2% to levels not seen in two years. Typically seen as an inflation hedge, gold has not lived up to the reputation after prices have moved lower while inflation has moved rapidly higher. While sovereign nations’ appetites for gold has continued to hold up, aggressive rate hikes from the U.S. Fed have suppressed gold’s appeal. The drop in industrial activity suppressed silver prices over the month.

The bright spot within commodities in July came from the Livestock sector. The S&P GSCI Lean Hogs rose 11.9% on the back of U.S. hog herd concerns and lower feed prices. Seasonal summer demand for meat continues to be strong this year.

The posts on this blog are opinions, not advice. Please read our Disclaimers.

Schrödinger’s Carbon: Intensity and Paris Alignment

Contributor Image
Maya Beyhan

Senior Director, ESG Specialist, Index Investment Strategy

S&P Dow Jones Indices

In quantum mechanics, Schrödinger’s Cat refers to the paradoxical consequences of a thought experiment: can a cat be simultaneously dead and alive? A similarly counterintuitive phenomenon can be found in the context of climate-based analysis: whereby an index may boast a relatively low carbon intensity and yet, perhaps surprisingly, not be judged as aligned with the goals of the Paris Agreement. A case study illustrates the importance of considering both point-in-time and forward-looking analysis in understanding the results, as well as the value of sector-based perspectives.

Two S&P 500®-based indices, the S&P 500 ESG Index and S&P 500 Fossil Fuel Free Index, offer a particularly illuminating example. The point-in-time and forward-looking components of our analysis are provided, respectively, by the index-weighted carbon intensity and via the S&P Global Trucost Paris-Alignment dataset.1

As reported in S&P DJI’s new Climate and ESG Index Dashboard, the S&P 500 Fossil Fuel Free Index achieved a carbon intensity reduction of 10.6% relative to the S&P 500, while the S&P 500 ESG Index achieved a higher carbon intensity reduction of 21.0%.2, 3 But such figures are based only on the most recent emissions figures of constituents—a point-in-time perspective.

The results of the forward-looking analysis show a different picture: the S&P 500 ESG Index achieves a Paris-Alignment score of > 3°C, notably even higher than the benchmark S&P 500’s score of 2-3°C. On the other hand, the S&P 500 Fossil Fuel Free Index receives a score of 1.5-2°C. Exhibit 1 provides further detail, including a sector-level breakdown for each of the three indices.

Exhibit 1 also illustrates a sectoral perspective on the drivers of the index scores: the S&P 500 ESG Index holds a weight of 7% in sectors with a Paris-Alignment score of > 5°C, 4% higher than the S&P 500 Fossil Fuel Index’s weight, and a little higher than the S&P 500’s. Conversely, the S&P Fossil Fuel Free Index has a 73% weight in sectors with a 1.5-2.0°C alignment and only a 3% weight in > 5°C-sectors.

Alignment levels across sectors are highly dispersed, as Exhibit 2 emphasizes. By a significant margin, Energy companies have the weakest level of alignment, while Financials, Health Care and Real Estate, with typically lower direct emissions, show better results. The same applies to new economy sectors like Information Technology, where cost-effective abatement technologies have been easier to develop in comparison to “old economy” sectors, such as Materials.

The Utilities sector brings us back to the paradox set out in the beginning: the sector is well known as the highest direct emitter, and yet Exhibit 2 shows it has the second-highest proportion aligned with a < 2.0°C scenario of any sector. But a company with high current emissions may also be on a strong improvement trajectory, and large emitters can be very well aligned under transition pathway assessments. This is the case for the Utilities sector overall; a little like the infamous half-alive quantum feline, it is both dirty and clean.

Such examples illustrate the nuanced distinctions between carbon intensity and decarbonization trajectory. A detailed look at how the S&P DJI’s suite of indices performs in both dimensions is now offered free on a quarterly basis via our newly launched Climate & ESG Index Dashboard.

Register here to receive quarterly insights and performance attributions for our range of flagship ESG and Climate indices.


1 The dataset allows for the identification of the scale of company-level reductions required by 2030 and beyond to meet various climate-related objectives, such as a 1.5°C or 2°C maximum increase. More details may be found here.

2 All figures as of June 30, 2022. For more details, please refer to S&P DJI’s Climate & ESG Index Dashboard.

3 The S&P ESG Index Series does not have an explicit objective of reducing GHG or to align with any particular climate scenario.

The posts on this blog are opinions, not advice. Please read our Disclaimers.

What Fixed Income Index Liquidity Means for Insurers

How are index-based strategies helping insurers measure and address liquidity in their portfolios? Take a closer look at the why index liquidity matters with S&P DJI’s Nick Godec, Morgan Stanley’s Meredith Shaw, and BlackRock’s James Winslow.

The posts on this blog are opinions, not advice. Please read our Disclaimers.

Steep Declines for Islamic Benchmarks in Q2, Lagging Conventional Indices YTD

Contributor Image
John Welling

Senior Director, Head of Global Equity Indices

S&P Dow Jones Indices

Global equities fell 15.7% during Q2, as measured by the S&P Global BMI, accumulating losses of 20.4% YTD. Shariah-compliant benchmarks, including the S&P Global BMI Shariah and Dow Jones Islamic Market (DJIM) World Index, continued to underperform their conventional counterparts YTD in part due to continued weakness in the Information Technology sector, which fell 30.1% during the period.

Major regional broad-based Shariah and conventional benchmarks likewise concluded with steep negative performance YTD, as central bank actions to contain runaway inflation weighed on markets. The Pan Arab region, meanwhile, vastly outperformed, as the Shariah benchmark finished with only marginal losses.

Drivers of YTD Shariah Index Performance

While global equities declined broadly over the first half of 2022, sector performance played a part in the relative underperformance of Shariah-compliant equity benchmarks. Information Technology, which is heavily represented in Islamic indices, fell 30.2%, contributing most heavily to the broad underperformance over the period, as growth-oriented tech shares have suffered during the recent downturn. Consumer Discretionary likewise fell 31.4%, representing the next greatest negative contribution to returns, as inflation and economic concerns worried consumers.

Despite a June pullback, Energy remained the sole positive sector YTD, outpacing the broader market by strides, as supply constraints bolstered shares (see Exhibit 2). Due to its low weight in Islamic indices, however, the performance impact remained relatively muted.

MENA Equities Lose Ground

MENA regional equities reversed in Q2, following several quarters of positive performance. The regional S&P Pan Arab Composite sank 12.7% in Q2, leading to a minor gain of 0.4% YTD. All GCC country indices besides Oman suffered losses during the recent quarter, led by the S&P United Arab Emirates BMI (down 17.1%) and the S&P Saudi Arabia BMI (down 13.0%). Meanwhile, the S&P Oman BMI eked out a 0.2% gain during the quarter. Year-to-date, there was high dispersion of returns across countries, as Oman gained 10.4% and Egypt lost 34.3% in U.S. dollar terms.

For more information on how Shariah-compliant benchmarks performed in Q2 2022, read our latest Shariah Scorecard.

This article was first published in IFN Volume 19 Issue 28 dated July 13, 2022.

The posts on this blog are opinions, not advice. Please read our Disclaimers.

A Risk Control Approach to Cryptocurrencies: A Tool for a Crypto Winter

Contributor Image
Sharon Liebowitz

Former Head of Innovation

S&P Dow Jones Indices

Earlier this year, we reported on the volatility of Bitcoin and cryptocurrencies overall. In February 2022, the market was slightly down from its all-time high in November 2021. S&P Dow Jones Indices had just launched the new S&P Bitcoin and Ethereum Dynamically Rebalancing Risk Control 40% Indices (CET Close), and we saw that risk-adjusted performance over time of the Bitcoin risk control index exceeded that of the underlying S&P Bitcoin Index.

Since then, the crypto market has experienced a significant downturn, while equities officially entered a bear market. For crypto, the collapse of Terra and its sister coin Luna,1 the halt of withdrawals from the Celsius network2 and the contagion to other firms such as crypto hedge fund Three Arrows Capital and crypto lender Babel3 created difficult conditions in the second half of the Q2.

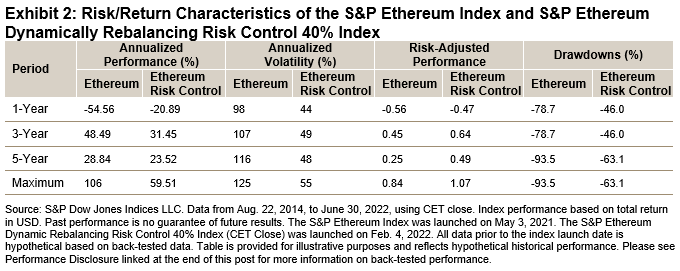
Why not review how the crypto risk control indices performed through this time period and see how they met the index methodology goals of mitigating volatility?

Exhibits 1 and 2 show the performance for the S&P Bitcoin and S&P Ethereum Dynamically Rebalancing Risk Control 40% Indices and their underlying benchmark indices.

Specifically, for the Bitcoin risk control index, during the June market drop, the rebalance was triggered three times. The rebalance adjusts the exposure to the underlying index and allocates to U.S. dollars on any given day when the 10% threshold based on exposure is crossed. While the benchmark S&P Bitcoin Index was down 40% in June, the S&P Bitcoin Dynamically Rebalancing Risk Control 40% Index was down just 21%. This demonstrates how responsive the dynamic nature of the risk control index is to the current market conditions, and the methodology mitigated the effects of volatile, declining markets.

However, not all is gloom and doom in the crypto space. It is worth noting that the S&P Bitcoin Index was up 15% in the first week of July (as of July 7, 2022), and the S&P Bitcoin Dynamically Rebalancing Risk Control 40% Index was up 4% during this period. As expected with this asset class, volatility continues, and risk control can help mitigate it.


For additional details, please refer to the S&P Risk Control Indices Methodology & Parameters for current parameters and to the S&P Risk Control Indices section of the S&P DJI Index Mathematics Methodology.

For S&P DJI, this is another innovative way to bring tools and transparency to this emerging asset class.


1 https://www.coindesk.com/learn/the-fall-of-terra-a-timeline-of-the-meteoric-rise-and-crash-of-ust-and-luna/

2 https://www.coindesk.com/business/2022/06/15/celsius-troubles-ust-collapse-could-have-long-term-benefits-for-crypto-fsinsight-says/

3 https://www.coindesk.com/layer2/2022/06/29/why-the-crypto-unwind-wasnt-contagious-this-time/; https://www.coindesk.com/business/2022/07/01/troubled-crypto-lender-babel-finance-looking-to-hire-restructuring-specialist-houlihan-lokey-sources/

The posts on this blog are opinions, not advice. Please read our Disclaimers.