Get Indexology® Blog updates via email.

In This List

29 Years of VIX

Insurance General Accounts See Increased Fixed Income ETF Adoption in 2021

Examining the Effectiveness of Indexing Small Caps

Value Vulnerabilities

Introducing the S&P 500 ESG Leaders Index

29 Years of VIX

Contributor Image
Berlinda Liu

Former Director, Multi-Asset Indices

S&P Dow Jones Indices

In 1993, the Chicago Board Options Exchange (Cboe) announced the launch of the Cboe Market Volatility Index or VIX®, which provides market participants with a barometer to measure market sentiment. Since then, the index has become one of the most followed benchmarks. In commemoration for its 29th anniversary, we take a look at the evolution of the index.

The VIX concept arises from the research of Menachem Brenner and Dan Galai in 1989. They believed that the so-called Sigma index “would play the same role as the market index plays for options and futures on the index.”1 Professor Robert E. Whaley then designed the first version of VIX based on the Black-Scholes model, using at-the-money S&P 100 options.2

In 2003, Cboe revised the VIX methodology with the help of Goldman Sachs.3 The revised VIX now uses a more robust model that captures options of all strikes and the most liquid index option in the market, S&P 500® options. The index name became the Cboe Volatility Index, or VIX.

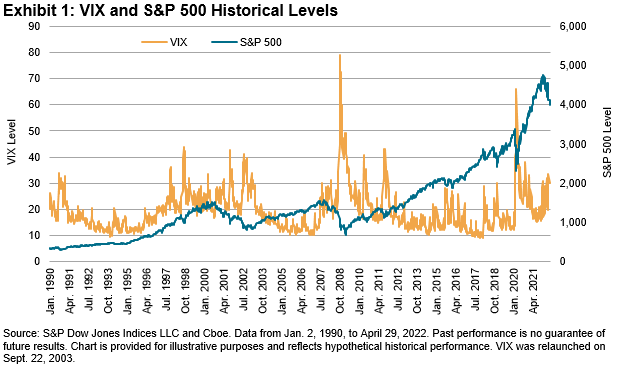
With nearly three decades of history, VIX exhibits a few time-honored characteristics. In the long run, VIX has shown a clear mean-reverting trend. For most of the time, it ranges between 13 (~20th percentile) and 25 (~80th percentile), with a mean of ~19.5 and a median of ~17.5. In the first four months of 2022, we’ve seen VIX hovering above 25 or even 30 (~90th percentile), indicating the elevated risk and anxiety in the financial market.

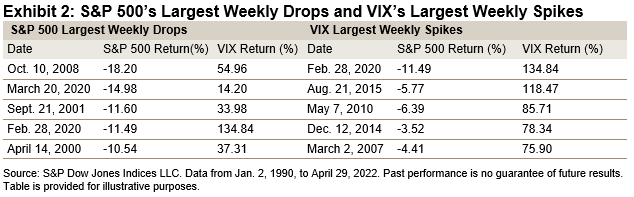
In the short term, however, VIX tends to move fast, usually in the opposite direction of the S&P 500. The correlation between VIX and the broad U.S. equity market is ~-75% on average and has gone as high as -90% during volatile market environments. For example, during all the weeks since 1990 when the S&P 500 dropped at least 5%, VIX showed a positive return. In the week ending Feb. 28, 2022, the S&P 500 declined 11.49% and VIX jumped 134.84%, its highest weekly return since 1990. This is why VIX is sometimes referred to as Wall Street’s “fear gauge.”

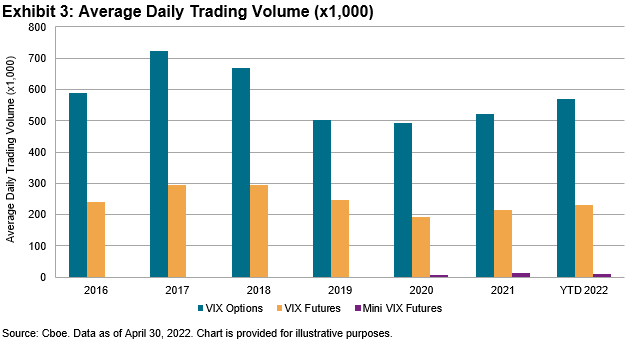
The strong negative correlation between VIX and the U.S. equity market makes VIX derivatives attractive hedging tools for market participants. VIX options are now the second most liquid index options on Cboe. Increased demand from market participants led Cboe to extend VIX futures trading hours and list mini VIX futures in recent years. In the first four months of 2022, the average daily value of VIX futures and options increased by 7% and 9%, respectively, compared with 2021.

In January 2009, the first suite of tradable VIX futures indices were launched in response to increasing demand for effective hedging tools for broad equity market risk. The S&P 500 VIX Short-Term Futures Index has since grown into one of the most actively followed indices for equity and volatility traders.

VIX and VIX futures indices are still new compared with other broad market measures such as the S&P 500 and the Dow Jones Industrial Average®. However, their negative correlation with the U.S. equities market and hedging capabilities indicate that their popularity among investors could continue for decades to come.

1 Brenner, Menachem; Galai, Dan (1989). “New Financial Instruments for Hedging Changes in Volatility.” Financial Analysts Journal. 45 (4): 61–65. ISSN 0015-198X.

2 Bob Pisani (March 29, 2020). “Father of Wall Street’s ‘fear gauge’ sees wild volatility continuing until coronavirus cases peak.”

3 vixwhite.pdf (cboe.com)

The posts on this blog are opinions, not advice. Please read our Disclaimers.

Insurance General Accounts See Increased Fixed Income ETF Adoption in 2021

Contributor Image
Raghu Ramachandran

Head of Insurance Asset Channel

S&P Dow Jones Indices

As of year-end 2021, insurance companies held USD 45.4 billion in ETFs in their general accounts—a 15% increase over 2020. We recently published a research piece on the use of ETFs by insurance companies. In this blog post, we explore the increased use of fixed income ETFs in these portfolios.

Fixed income securities comprise the majority of insurance portfolios. However, equity ETFs continue to constitute the majority of insurance companies’ ETF usage, largely due to regulatory constraints. Even as regulation has changed and made it easier for insurance companies to invest in ETFs, fixed income ETF adoption was slow. Recently, that has begun to change, and insurance companies’ fixed income ETF usage has nearly doubled in the past two years (see Exhibit 1).

Again, as to be expected, investment grade funds dominated insurance companies’ fixed income ETF usage, but there has been an increase in their use of high yield ETFs (see Exhibit 2). Over the past 1-, 3-, 5- and 10-year periods, the growth rate of high yield ETFs has exceeded the growth of investment grade ETFs within insurance general accounts. In 2021, high yield ETF AUM increased by 80%, and the proportion of ETFs invested in high yield by insurance companies exceeded the proportion of high yield ETFs in the overall U.S. ETF market.

Life insurance companies have driven the growth of fixed income ETF usage. In 2015, life companies had only USD 617 million invested in fixed income ETFs. By 2021, this had grown 13 times to reach USD 7.8 billion (see Exhibit 3). Indeed, as a proportion of the usage, life companies have a majority of their ETF investments in fixed income, whereas P&C companies still continue to invest mostly in equity ETFs. Health companies also invest heavily in fixed income ETFs, but their pool of assets is much smaller than that of life and P&C companies.

Even though insurance companies tended to hold fewer fixed income ETFs, they traded them more frequently. Trade volume for fixed income ETFs exceeded the trade volume for equity ETFs in 2019, and fixed income ETFs continued to dominate insurance trading through 2021 (see Exhibit 4). If we consider the trade ratio (the amount traded in a year divided by the assets held at the beginning of the year), we see that insurance companies used fixed income ETFs much more actively than equity ETFs (see Exhibit 5).

Given the size of the insurance fixed income pool, we continue to monitor this activity for future growth.

The posts on this blog are opinions, not advice. Please read our Disclaimers.

Examining the Effectiveness of Indexing Small Caps

How does profitability influence risk and return in small-cap equities and why is it important to know what’s under the hood of your small-cap index S&P DJI’s Garrett Glawe, State Street Global Advisors’ Matthew Bartolini, and ValMark Advisors’ Michael McClary take a closer look at the S&P SmallCap 600.

The posts on this blog are opinions, not advice. Please read our Disclaimers.

Value Vulnerabilities

Contributor Image
Anu Ganti

U.S. Head of Index Investment Strategy

S&P Dow Jones Indices

Value has experienced a dramatic reversal in 2022, with the S&P 500® Value outperforming the S&P 500 Growth by 20% on a YTD basis as of May 25, 2022. Although one might expect this outperformance to be a boon for value managers, the data may indicate otherwise.

A majority of active large-cap value managers outperformed the S&P 500 Value in only 8 out of the past 20 calendar years. Seven of these eight years have something in common: Growth outperformed Value. How did the outperformance of Growth aid value managers?

Style bias enables us to answer this question. We refer to “style bias” as any systematic tendency in an actively managed portfolio. For example, some portfolios might typically tilt toward growth stocks, and we’d refer to this tilt as a growth bias. This is different from making near-term tactical allocations between growth and value. Style bias helps us disentangle these biases from genuine stock selection skill.  

Exhibit 1 shows that a majority of large-cap value managers outperformed the S&P 500 Value in 39% (31/80) of all quarters. In the quarters when the S&P 500 Growth beat the S&P 500 Value, however, the likelihood that the majority of value managers outperformed rose to 59% (26/44). When Value outperformed Growth, the odds of active outperformance for value managers fell to 14% (5/36).

As a result, the recent underperformance of Growth implies that value managers would be unable to benefit from style bias.

Another headwind has to do with the positive skewness of equity returns: in most years, only a minority of constituent stocks outperform an index, making stock selection inherently more challenging. Exhibit 2 illustrates that only 38% of the names in the S&P 500 Value have outperformed the index thus far this year, making conditions challenging for active managers, who tend to run more concentrated portfolios.

Further, the S&P 500 Value return of -5.7% is greater than the simple average of the constituent returns (-8.1%), indicating that larger value stocks have outperformed. Berkshire Hathaway Class B and Johnson & Johnson, both of which handily outperformed the index, are the largest constituents in the index with a combined weight of 6%. The outperformance of larger value names coupled with positive skewness is doubly challenging for active managers, as it is relatively more difficult for them to overweight the larger names.

Value managers have historically benefited by tilting toward Growth. But not this year. And even within the Value realm, they are not aided by the outperformance of larger names. Value investors should keep this in mind if these trends continue.

The posts on this blog are opinions, not advice. Please read our Disclaimers.

Introducing the S&P 500 ESG Leaders Index

Look under the hood of an innovative, best-in-class ESG index, designed to track S&P 500 constituents with higher sustainability credentials based on exclusions and market-leading ESG scores.


The posts on this blog are opinions, not advice. Please read our Disclaimers.