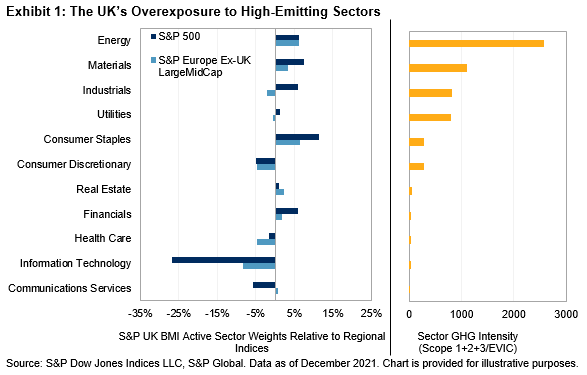
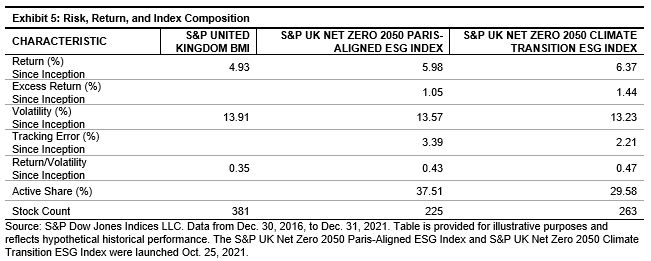
Overnight rates in the U.S. are one of two major levers that the Federal Open Market Committee (FOMC) can pull to change the course of inflation and employment, the other being quantitative easing. At present, the market expects the Fed to move both levers in the near future: hiking rates and starting to wind down their gargantuan bond portfolio.1
The market’s expectations for the future path of short-term interest rates is encoded into the prices of listed futures and options traded at the Chicago Mercantile Exchange and, conveniently, the exchange provides a handy tool that allows us to gauge the implied likelihood of various future interest rate levels. In recent weeks, interest rate futures have moved sharply to reflect a much steeper liftoff in rates than previously expected—and as of mid-February are suggesting a roughly 80% probability of overnight rates at or above 1.25% by the final FOMC meeting of 2022.

In theory, all else being equal, higher interest rates make equity investments less appealing, as they reduce the present value of corporate cash flows, and higher rates result in higher borrowing costs that eat into corporate earnings. Consistent with such theories, the prospect of monetary tightening has triggered declines in U.S. equities, with the S&P 500® starting the year with its worst January since 2009. But history offers caution against assuming a rate hike would necessarily imply the end of the bull run.
Before we dig into the details, a few qualifications are appropriate: the FOMC monetary policy framework has seen significant changes in the past 50 years, and, until relatively recently, the target overnight rate was not as central an instrument in the Fed’s toolkit as it is today. In fact, the Fed didn’t even officially disclose its target overnight interest rate until October 1979, and even when it started doing so, the money supply remained the primary tool of conducting monetary policy. The primacy of the federal funds rate was established only in 1982, and the current framework (including the issuance of a statement following each FOMC meeting and the release of meeting minutes a few weeks later) has only been in place since 1994.2 Historically, the benchmark overnight rate was a lot more volatile on a day-to-day basis, as is evident in Exhibit 2.

As Exhibit 2 demonstrates, there were eight distinct interest rate hiking cycles in the U.S. since the collapse of the Bretton Woods system in mid-1971. For reference, the first year in which rates rose in each cycle was, in chronological order: 1973, 1977, 1985, 1988, 1994, 1999, 2004, and 2015.
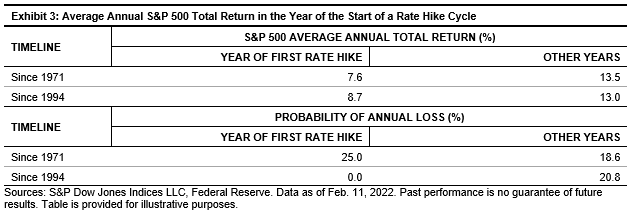
During those years, as Exhibit 3 shows, the S&P 500 underperformed, on average, compared to years that did not contain a first hike in rates. However, the average return remained positive and, more intriguingly, the performance differential narrowed after the current framework of monetary policy was adapted in 1994. Digging in a little further, the S&P 500 declined only in one-quarter of years in which a hike cycle began, with the benchmark finishing higher in each one since 1994.
Unfortunately, we only have a few such historical occasions to examine (and this time, as they say, may be different). But while it may be foolish to draw conclusions from this small a sample, such are the limits of history. We may be even more foolish to ignore what our small sample tells us; the experiences of the past half century do not back the popular narrative that the start of a rate hike cycle necessarily goes hand in hand with broad-based losses for U.S. large caps. While we may be left with considerable uncertainty, whatever else happens, our sample size looks set to expand this year.
1 Federal Reserve, “Summary of Economic Projections – Dec. 15, 2021.”
2 For an overview of how the Fed’s monetary policy evolved, see: Pakko, M. R., The FOMC in 1993 and 1994: Monetary Policy in Transition.
The posts on this blog are opinions, not advice. Please read our Disclaimers.