Get Indexology® Blog updates via email.

In This List

Understanding SOFR

Copper Crashes the Energy Party in February

The S&P Systematic Global Macro Index – Trending to New Highs

Exploring the S&P/ASX All Technology Index’s Remarkable First Year

Man Bites Dog: The Year for Active Management?

Understanding SOFR

Contributor Image
Hong Xie

Former Senior Director, Global Research & Design

S&P Dow Jones Indices

In June 2023, the U.S. dollar London Inter-Bank Offered Rate (LIBOR) will likely be discontinued. The Alternative Reference Rates Committee has identified the Secured Overnight Funding Rate (SOFR) as the recommended alternative reference rate to replace USD LIBOR. SOFR is calculated as a volume-weighted median of transaction-level U.S. Treasury repurchase agreements data, reflecting borrowing cost in overnight borrowing collateralized by U.S. Treasury securities.

There are three major differences between SOFR and USD LIBOR.

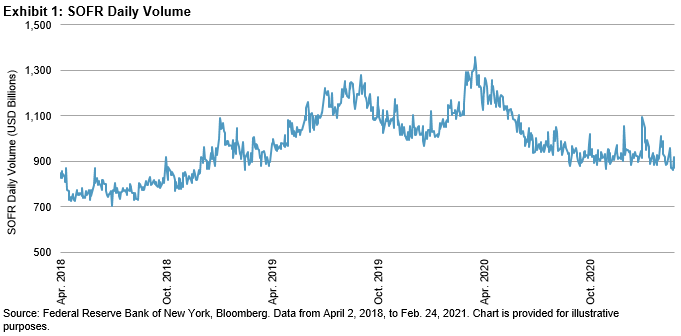
  1. SOFR is based on observable transactions in the largest rates market in the world at a given maturity. Since SOFR’s first publication in April 2018, the daily average volume of trades underlying it is about USD 977 billion (see Exhibit 1). In comparison, the Fed estimates that on a typical day, there are a handful of transactions worth a few hundred million dollars at most that underpin total seven tenors of USD LIBOR in the term unsecured bank funding market (Held, 2019).1 In fact, diminishing transactions underlying LIBOR is one of the main reasons that authorities are pushing the financial industry to transition away from LIBOR to more robust reference rates that are based on observable transactions rather than estimates.
  2. SOFR is an overnight rate and USD LIBOR includes seven tenors of forward-looking term rates.
  3. SOFR is nearly risk free as an overnight secured rate collateralized with U.S. Treasury bonds, while LIBOR is credit sensitive and embeds a bank credit risk premium.

Points 2 and 3 particularly make the transition from LIBOR to SOFR challenging.

One difficulty is that in the absence of SOFR-based term rates, SOFR compounded in arrears currently is the preferred replacement rate in many products. Calculated over the current interest period, it leaves little notice time before payment and poses significant operation disadvantages for some cash products (e.g., syndicated loans). A solution for this challenge would be to develop SOFR-based term rates, which are expected in the first half of 2021. However, the robustness of such rates would depend on the liquidity of relevant SOFR derivatives.

A second problem is that SOFR, without a bank credit premium, is not aligned with bank funding costs, and therefore opens up basis risk in banks’ asset liability management.

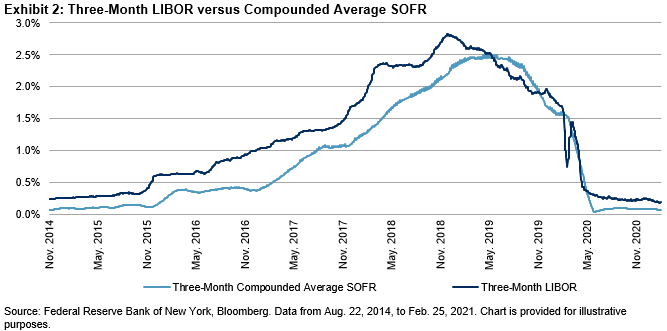
In many derivatives and some cash products, a compounded average SOFR is preferred to replace LIBOR, which naturally helps address the concern for the day-to-day volatility of SOFR. Exhibit 2 shows the comparison between three-month USD LIBOR and three-month compounded average SOFR since August 2014.2 The spread between them averages 0.29%, ranging between -0.78% and 0.91%.

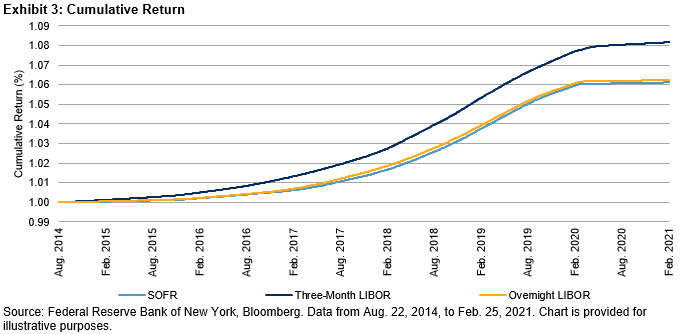
USD LIBOR is frequently used as a cash rate in an index that has a cash investment or requires funding. Exhibit 3 compares the cumulative returns of a cash investment using SOFR with overnight and three-month LIBOR. In annualized terms, a SOFR-based cash return was lower than those based on overnight and three-month LIBOR by 0.30% and 0.02%, respectively, over the past six and a half years.

SOFR is expected to replace LIBOR in a variety of financial products as benchmark reference rates. It is imperative to understand SOFR to identify the appropriate form of SOFR for LIBOR replacement and conduct impact analysis.

1 Michael Held: SOFR and the transition from LIBOR

2 The Federal Reserve Bank of New York publishes daily historical indicative SOFR from August 2014 to March 2018. Official SOFR data starts on April 2, 2018.

The posts on this blog are opinions, not advice. Please read our Disclaimers.

Copper Crashes the Energy Party in February

Contributor Image
Jim Wiederhold

Former Director, Commodities and Real Assets

S&P Dow Jones Indices

An inflationary tide lifted almost all commodity boats in February 2021. Most constituents of the S&P GSCI rose while gold, the commodity that market participants often look to for inflation protection, lagged. The S&P GSCI rose 10.6% overall in February, with copper and energy doing most of the heavy lifting.

After a strong January, the S&P GSCI Crude Oil accelerated further in February, rising 18.1%. A combination of continued OPEC+ production compliance and a historic cold weather event in Texas, knocking out more than four million barrels per day of production, were the catalysts driving this oil price gush. The remaining energy commodities followed suit, with gains of at least 9% for the month.

The S&P GSCI Copper woke up in February to join the energy party, rising 15.6%, close to double the next-best-performing industrial metal, the S&P GSCI Aluminum. Copper inventories were depleted and remained at levels not seen since 2005. The swiftness of the decline in copper inventories was unprecedented. The ramp up in manufacturing activity continues across the world, as demonstrated by the latest strong PMI readings. The clean air push is also contributing to the rally in industrial metals. China’s upcoming NPC meeting will be a highlight, with this event likely to affect future demand, as well as the production of aluminum, the most energy-intensive metal to produce.

The S&P GSCI Gold fell 6.6% in February as safe haven assets were sold off in favor of more bullish asset classes and U.S. bond yields spiked. This was the largest monthly drop in gold prices since November 2016. The S&P GSCI Platinum rose 9.8%, breaking out to a five-year high on the back of a potential third year of global supply deficits and new market awareness of the metal’s use in hydrogen energy technologies.

The S&P GSCI Agriculture ended the month up 2.1%; soybeans and corn rallied to multi-year highs, driven by relentless buying from China as it rebuilds its hog herd following the devastation caused by African swine fever. The S&P GSCI Sugar rallied 8.8% in February, with industry forecasters further trimming sugar surplus estimates for the current and new crop years.

The livestock sector was dominated by an impressive rally in lean hogs; the S&P GSCI Lean Hogs rose 13.7%. Lean hog futures have been trending higher since mid-December 2020 due to a combination of higher wholesale prices, extreme weather events, and exports to other markets helping offset the expected decline in shipments to China.

The posts on this blog are opinions, not advice. Please read our Disclaimers.

The S&P Systematic Global Macro Index – Trending to New Highs

Contributor Image
Rupert Watts

Head of Factors and Dividends

S&P Dow Jones Indices

The S&P Systematic Global Macro Index (S&P SGMI) is a trend-following strategy that takes long or short positions in 37 constituent futures across equites, commodities, fixed income, and FX.

In 2020, the S&P SGMI did particularly well during the COVID-19-related drawdowns, finishing March up 11.3%, and closing the year at an all-time high. Thus far in 2021, the index has continued along this path, reaching new highs. As Exhibit 1 shows, the full-year 2020 return was 12.76% and the 2021 return is 11.17% YTD.

Much of the recent positive performance has come from commodities. This mostly occurred during the first quarter of 2020, when downward momentum in energy markets gathered pace, and Q4 2020 and YTD 2021, as vaccine news boosted hopes of an economic recovery and the U.S. dollar weakened.

To highlight the role that commodities played, Exhibit 2 shows the performance of two standalone subindices computed using the same methodology as the S&P SGMI. The first is the S&P Systematic Global Macro Commodities Index (S&P SGMI Commodities; the physical commodity futures component), and the second is the S&P Systematic Global Macro Financials Index (S&P SGMI Financials; the equity, fixed income, and FX components).

Notably, the performance of the S&P SGMI significantly exceeded that of its peers, the SG CTA Index and the SG Trend Index. The SG CTA Index tracks the performance of a pool of commodity trading advisors (CTAs) selected from larger managers that are open to new investment. The SG Trend Index is a subset of the SG CTA Index, and follows traders of trend-following methodologies.

As Exhibit 3 shows, the S&P SGMI outperformed the SG CTA Index and the SG Trend Index by 9.60% and 6.48%, respectively, for the full-year 2020 and by 6.92% and 4.79%, respectively, so far in 2021.

How Does the Index Work?

The S&P SMGI rebalances monthly and the methodology involves two core steps: the position direction decision and the weighting decision.

The Position Direction Decision:

The goal of the trend-following algorithm is to identify the most current, statistically relevant trend by assessing each constituent future independently, using an iterative process.

A linear regression is used to determine if the constituent future is in an upward or downward trend. If the regression slope coefficient is positive (negative), the component is deemed to be in an upward (downward) trend.

While the length of a particular trend will vary, the S&P SGMI uses the most recent period during which the trend was stable. This is determined using an iterative process that starts with a 22-day period and tests additional 5-day increments until the longest stable trend is identified using a statistical test.

The Weighting Decision:

The index allocates risk capital evenly across and within each of the sectors with the goal that no single sector or constituent drives the volatility of the index. The weights are then leveraged to meet the volatility target subject to a 3x leverage constraint.

Conclusion

Trend-following strategies can play an important role in client portfolios, offering diversifying return sources that may improve risk-adjusted return over the long term. As we enter the second year of the COVID-19 pandemic, it will be interesting to see if the S&P SGMI’s strong performance continues.

The posts on this blog are opinions, not advice. Please read our Disclaimers.

Exploring the S&P/ASX All Technology Index’s Remarkable First Year

Contributor Image
Michael Orzano

Head of Global Exchanges Product Management

S&P Dow Jones Indices

As we mark the first anniversary of the S&P/ASX All Technology Index, it seemed an opportune time to look back at what can only be described as a remarkable inaugural year.

After peaking on Feb. 17, 2020—just one trading day post launch—the index plunged nearly 50% over the ensuing month, bottoming out on March 23 at the height of the pandemic-led selloff. Around this time, however, investors realized that Australia’s technology-driven companies were likely to be less affected by—and may even benefit from—the pandemic-related economic and social dislocations. By July 2, the index had fully retraced its losses, jumping 90% in just over three months. As of Feb. 14, 2021, the S&P/ASX All Technology Index gained 41% in the one-year period since its launch, powered by a 163% increase since the March low. In comparison, the tech-heavy U.S. Nasdaq 100 Index gained a comparatively small 25% in AUD terms and the S&P/ASX 200 had not yet returned to its pre-pandemic level.

As depicted in Exhibit 2, Afterpay accounted for more than three-quarters of the S&P/ASX All Technology Index’s total return during its first year, as its nearly 300% price increase propelled the company to the top of the index. In fact, Afterpay is now the 12th-largest Australian company by market cap, up from number 52 a year ago. However, the strength of Australia’s technology industry extended well beyond this single high-flyer. Fellow top index holdings, Xero, NEXTDC, and Seek, each returned more than 40% over the past year. Meanwhile, online marketplace Redbubble was the index’s top performer, gaining nearly 412%.

As illustrated in Exhibit 3, the composition of the index has shifted considerably since its launch. Most notably, Afterpay’s outsized performance has pushed its weight up to 25%, well above any other company. Importantly, the S&P/ASX All Technology Index methodology includes a 25% single stock cap in order to limit the influence of any single name and improve diversification. This cap is applied at each quarterly rebalance.

Despite the extreme market volatility experienced following the introduction of the index, the Australian technology industry has thrived of late. During the past year, the S&P/ASX All Technology Index expanded from 46 to 69 constituents, while its total market cap increased by AUD 80 billion (up 78%) to AUD 182.4 billion. In total, 26 companies were added to the index over the past year, while just 3 were removed.

While the S&P/ASX Technology Index will likely have a tough time surpassing the excitement experienced during its first year, it will no doubt continue to provide meaningful insights into this dynamic segment of Australia’s equity market for years to come.

The posts on this blog are opinions, not advice. Please read our Disclaimers.

Man Bites Dog: The Year for Active Management?

Contributor Image
Craig Lazzara

Former Managing Director, Index Investment Strategy

S&P Dow Jones Indices

For at least five years, we’ve noticed that, despite historical performance, active managers regularly proclaim that this year will at last be the time when active management shows its value. I suspect that most advocates of indexing derive at least some guilty pleasure from observing this ritual. (I know I do.) So, we want to ask, if you know that active management will outperform this year, did you also know that passive would outperform last year? If you knew, why didn’t you say so? And if you didn’t know then, why should we believe that you know now?

All of which implies that when we see some evidence that 2021 might be a relatively favorable environment for active managers, we should say so. Here are three hopeful signs for active managers.

• Last year’s returns were dominated by the exceptional performance of very large-cap stocks. As readers of our daily dashboard will recognize from Exhibit 1, 2021 so far looks to be a different story. Year-to-date through Feb. 22, 2021, the S&P 500® is up 3.43%, lagging the performance of the S&P MidCap 400® (up 9.71%) and S&P SmallCap 600® (up 16.00%). The S&P 500 Equal Weight has risen 6.45% over the same period, indicating that the average stock in the S&P 500 is beating the cap-weighted average. All of these indicators are historically suggestive of a relatively benign environment for large-cap active managers, most of whose portfolios tilt toward smaller names.

• Dispersion has been running at above-average levels (dramatically so in the case of small caps). If a manager has genuine stock selection skill, high dispersion will reward it (just as it will penalize its counterfeit).

• Correlation among stocks, although not far off average levels currently, has run well above average for the past year. High correlations provide a paradoxical benefit to active managers.

Correlations can be confusing, because we all learn in basic finance that low correlations are good. For a given set of assets and weights, lower correlation will mean less volatility. But assets and weights are not given when we compare active and passive management; the essence of active management is to choose a different set of assets and weights from those of a passive benchmark. Doing so typically produces a portfolio with more volatility than its benchmark. How much more? It depends on correlations. If correlations are relatively low, an active portfolio will bear much more volatility than its benchmark. If correlations are relatively high, the active manager forgoes a smaller diversification benefit.

Active returns in 2021 might therefore benefit from the improved relative performance of smaller names and the generally higher level of dispersion, without bearing dramatically higher levels of incremental volatility. If  these trends continue, then 2021 might at last be the year when active management reaches its sunlit uplands.

The posts on this blog are opinions, not advice. Please read our Disclaimers.