Get Indexology® Blog updates via email.

In This List

Exploring the S&P/ASX All Technology Index’s Remarkable First Year

Man Bites Dog: The Year for Active Management?

Raising the Bar with the S&P 500 ESG Elite Index

Accessing the Expanding S&P 500 ESG Index Ecosystem

Accessing the Growth of the “New China” Economy

Exploring the S&P/ASX All Technology Index’s Remarkable First Year

Contributor Image
Michael Orzano

Head of Global Exchanges Product Management

S&P Dow Jones Indices

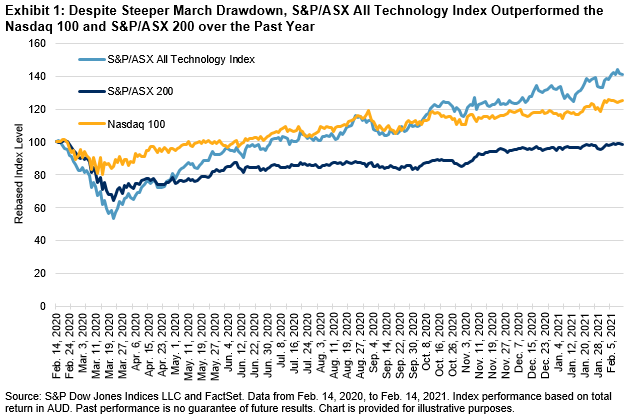
As we mark the first anniversary of the S&P/ASX All Technology Index, it seemed an opportune time to look back at what can only be described as a remarkable inaugural year.

After peaking on Feb. 17, 2020—just one trading day post launch—the index plunged nearly 50% over the ensuing month, bottoming out on March 23 at the height of the pandemic-led selloff. Around this time, however, investors realized that Australia’s technology-driven companies were likely to be less affected by—and may even benefit from—the pandemic-related economic and social dislocations. By July 2, the index had fully retraced its losses, jumping 90% in just over three months. As of Feb. 14, 2021, the S&P/ASX All Technology Index gained 41% in the one-year period since its launch, powered by a 163% increase since the March low. In comparison, the tech-heavy U.S. Nasdaq 100 Index gained a comparatively small 25% in AUD terms and the S&P/ASX 200 had not yet returned to its pre-pandemic level.

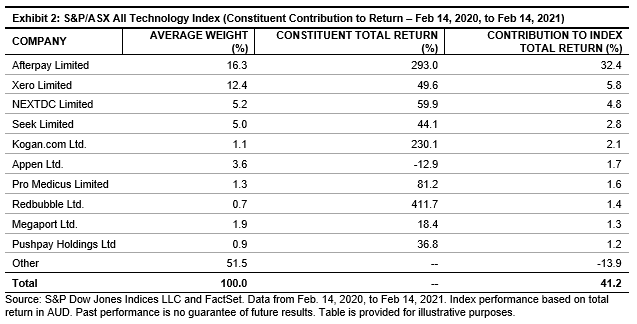
As depicted in Exhibit 2, Afterpay accounted for more than three-quarters of the S&P/ASX All Technology Index’s total return during its first year, as its nearly 300% price increase propelled the company to the top of the index. In fact, Afterpay is now the 12th-largest Australian company by market cap, up from number 52 a year ago. However, the strength of Australia’s technology industry extended well beyond this single high-flyer. Fellow top index holdings, Xero, NEXTDC, and Seek, each returned more than 40% over the past year. Meanwhile, online marketplace Redbubble was the index’s top performer, gaining nearly 412%.

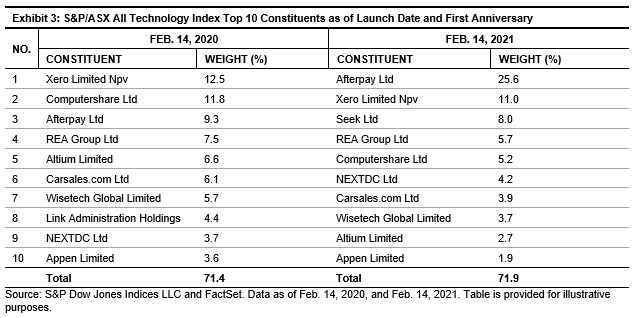
As illustrated in Exhibit 3, the composition of the index has shifted considerably since its launch. Most notably, Afterpay’s outsized performance has pushed its weight up to 25%, well above any other company. Importantly, the S&P/ASX All Technology Index methodology includes a 25% single stock cap in order to limit the influence of any single name and improve diversification. This cap is applied at each quarterly rebalance.

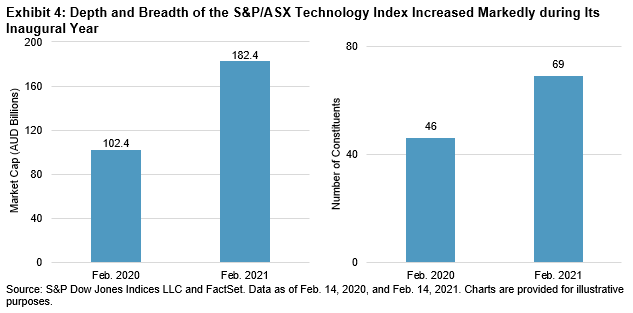
Despite the extreme market volatility experienced following the introduction of the index, the Australian technology industry has thrived of late. During the past year, the S&P/ASX All Technology Index expanded from 46 to 69 constituents, while its total market cap increased by AUD 80 billion (up 78%) to AUD 182.4 billion. In total, 26 companies were added to the index over the past year, while just 3 were removed.

While the S&P/ASX Technology Index will likely have a tough time surpassing the excitement experienced during its first year, it will no doubt continue to provide meaningful insights into this dynamic segment of Australia’s equity market for years to come.

The posts on this blog are opinions, not advice. Please read our Disclaimers.

Man Bites Dog: The Year for Active Management?

Contributor Image
Craig Lazzara

Former Managing Director, Index Investment Strategy

S&P Dow Jones Indices

For at least five years, we’ve noticed that, despite historical performance, active managers regularly proclaim that this year will at last be the time when active management shows its value. I suspect that most advocates of indexing derive at least some guilty pleasure from observing this ritual. (I know I do.) So, we want to ask, if you know that active management will outperform this year, did you also know that passive would outperform last year? If you knew, why didn’t you say so? And if you didn’t know then, why should we believe that you know now?

All of which implies that when we see some evidence that 2021 might be a relatively favorable environment for active managers, we should say so. Here are three hopeful signs for active managers.

• Last year’s returns were dominated by the exceptional performance of very large-cap stocks. As readers of our daily dashboard will recognize from Exhibit 1, 2021 so far looks to be a different story. Year-to-date through Feb. 22, 2021, the S&P 500® is up 3.43%, lagging the performance of the S&P MidCap 400® (up 9.71%) and S&P SmallCap 600® (up 16.00%). The S&P 500 Equal Weight has risen 6.45% over the same period, indicating that the average stock in the S&P 500 is beating the cap-weighted average. All of these indicators are historically suggestive of a relatively benign environment for large-cap active managers, most of whose portfolios tilt toward smaller names.

• Dispersion has been running at above-average levels (dramatically so in the case of small caps). If a manager has genuine stock selection skill, high dispersion will reward it (just as it will penalize its counterfeit).

• Correlation among stocks, although not far off average levels currently, has run well above average for the past year. High correlations provide a paradoxical benefit to active managers.

Correlations can be confusing, because we all learn in basic finance that low correlations are good. For a given set of assets and weights, lower correlation will mean less volatility. But assets and weights are not given when we compare active and passive management; the essence of active management is to choose a different set of assets and weights from those of a passive benchmark. Doing so typically produces a portfolio with more volatility than its benchmark. How much more? It depends on correlations. If correlations are relatively low, an active portfolio will bear much more volatility than its benchmark. If correlations are relatively high, the active manager forgoes a smaller diversification benefit.

Active returns in 2021 might therefore benefit from the improved relative performance of smaller names and the generally higher level of dispersion, without bearing dramatically higher levels of incremental volatility. If  these trends continue, then 2021 might at last be the year when active management reaches its sunlit uplands.

The posts on this blog are opinions, not advice. Please read our Disclaimers.

Raising the Bar with the S&P 500 ESG Elite Index

Contributor Image
Jaspreet Duhra

Managing Director, Global Head of Sustainability Indices

S&P Dow Jones Indices

Starting with the big question, what does ESG mean to investors and can S&P DJI help?

Does it mean:

Can it mean combining best-in-class ESG scores and avoiding unsustainable and unethical business practices? Absolutely! Allow us to introduce the S&P 500 ESG Elite Index, which is designed for investors, unhindered by tracking benchmark returns, and motivated by sustainability and ethical concerns.

How Is the S&P 500 ESG Elite Index Constructed?

The first step is to apply an extensive range of global exclusions focused on business activities, Environmental, Social, and Governance (ESG) scores and United National Global Compact (UNGC) scores. The remaining eligible companies are ordered by S&P DJI ESG Score within their GICS® sectors and the top 25% in each sector are included in the S&P 500 ESG Elite Index.

Please see the index methodology for a full breakdown of the index construction rules.

Why Is the S&P 500 ESG Elite Index Different?

  • The index utilizes market-leading SAM, part of S&P Global, ESG datasets that are built on a foundation of hundreds of ESG data points collected from public sources, as well as direct company dialogue. SAM produces unique ESG surveys for 61 industries, based on salient ESG risks and opportunities. Only the top 25% of ESG scoring companies within each sector are included in the index.
  • Acknowledging the climate emergency and with climate being a top priority for ESG investors, extensive fossil fuel screens are applied.
  • A broad range of ESG exclusions are made, including nascent ESG screens such as palm oil and predatory lending, as well as more established screens such as alcohol and gambling.
  • Ongoing ESG controversy monitoring ensures any new significant ESG controversy between rebalances allows for a fast exit from the S&P 500 ESG Elite Index.
  • By selecting the top ESG performers within sectors, the index targets the same broad market exposure as the S&P 500.

What Are the Results?

  • The S&P 500 ESG Elite Index has a 31% higher aggregate S&P DJI ESG Score compared with the S&P 500.
  • The S&P 500 ESG Elite Index had a 44% lower carbon-to-revenue footprint compared with the S&P 500.

For those looking for the same broad market exposure as the flagship U.S. equity benchmark, the S&P 500, but with a focus on the best-performing ESG companies, the S&P 500 ESG Elite Index may fit the bill.

The posts on this blog are opinions, not advice. Please read our Disclaimers.

Accessing the Expanding S&P 500 ESG Index Ecosystem

The S&P 500 ESG Index has redefined mainstream access to ESG, providing global investors with new tools designed to help them align objectives with their ESG values. Explore how this expanding ESG ecosystem is defining the sustainable core with S&P DJI’s Mona Naqvi, Horizon Investments’ Scott Ladner, Axio Financial’s Peter Horacek, and Sage Advisory’s Bob Smith.


The posts on this blog are opinions, not advice. Please read our Disclaimers.

Accessing the Growth of the “New China” Economy

Contributor Image
John Welling

Senior Director, Head of Global Equity Indices

S&P Dow Jones Indices

As China’s economy matures, consumption and service-related industries are becoming structurally more important. Because the country’s stock market continues to have significant exposure to “old economy” sectors, many market participants are seeking alternative index solutions to participate more directly in China’s fastest growing areas.

Launched in September 2016, the S&P New China Sectors Index provides access to Chinese companies operating in specific industries poised to benefit from the country’s transition to a consumer- and service-oriented economy. The index includes all Chinese share classes, including A-shares and offshore listings (including those listed in the U.S.), as well as companies with a Hong Kong domicile. To distribute exposure more evenly and improve liquidity, 10% single stock caps are applied semiannually, and selection is limited to large and liquid stocks.

This focus on “new China” provides substantial relief from slower growing sectors of the economy, which retain a high exposure within existing, widely used Chinese equity benchmarks, such as the Hang Seng China Enterprises Index (HSCEI).

Slower growth among these “old economy” sectors has translated into lagging equity performance, particularly in recent years. Over the latest five-year period, the S&P New China Sectors Index has returned more than 25.3% per year, while the HSCEI has returned only 10.8%—an outperformance that speaks to the powerful driving forces of the more surgent economic sectors.

What Has Driven the Outperformance?

Analysis of top contributors shows that outperformance was spread out widely, with tech-giants Alibaba and Tencent contributing most toward outperformance, while Kweichow Moutai and Meituan Dianping further illustrated the importance of the rising consumer. The top 10 contributors accounted for just under half of the outperformance of the S&P New China Sectors Index versus the broad-based S&P China 500 over the most recent five-year period.

Industry attribution, meanwhile, shows that outperformance was concentrated largely within the “new economy” sectors. This outcome is even more apparent when compared with the HSCEI, in large part due to its greater concentration in banks and other “old economy” industries.

By focusing on consumer- and service-related companies, the S&P New China Sectors Index offers a high level of differentiation from traditional Chinese equity benchmarks and more directly measures one of the key megatrends affecting the Chinese economy.

For further information, refer to our Talking Points overview of the S&P New China Sectors Index.

The posts on this blog are opinions, not advice. Please read our Disclaimers.