


Indexing is democratizing access to defined outcomes, providing a simple, transparent, index-based blueprint for target outcome strategies that can be applied to both active and passive vehicles. Take a closer look at what makes these indices tick and the range of potential applications for these innovative tools.
The posts on this blog are opinions, not advice. Please read our Disclaimers.How Target Outcome Indices Work
The Case for Investing in Water
Global Diversification in 2020 – Is India Seeing This Opportunity?
Continued Dominance of Growth Style Investing
Not a Coincidence
How Target Outcome Indices Work
The Case for Investing in Water

Water is essential to the production and delivery of nearly all goods and services. Many businesses are reliant on a sufficient flow of clean water to operate and realize their growth ambitions. Overconsumption of water, water pollution, environmental degradation, and changing climatic conditions are making clean water an increasingly scarce resource.1 As the world population grows and competition for water resources between industry sectors intensifies, nations are set to experience a 40% shortfall in water by 2030.2
As these demands for clean water increase, companies involved in water-related business activities stand to grow in the coming years. Allocation to water can be systematically captured by rules-based, transparent index construction. Market participants could utilize index-linked water strategies to gain exposure to water, manage water risk, express their sustainability views, or allocate as part of a broader natural resource theme.
THE S&P GLOBAL WATER INDEX
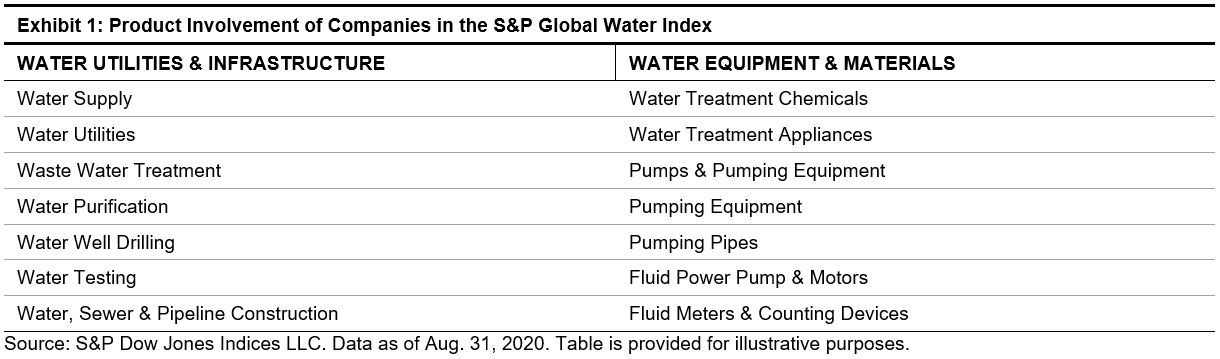
The S&P Global Water Index is designed to track 50 of the largest publicly traded companies involved in water-related business activities through two distinct clusters: Water Utilities & Infrastructure and Water Equipment & Materials.
The underlying universe consists of securities trading on a developed market exchange with a minimum three-month average daily value traded of USD 1 million (USD 500,000 for current constituents), a total market capitalization of USD 250 million, and a float-adjusted market capitalization of USD 100 million after each rebalancing.
Given that companies can have multiple business segments and not all may derive from water-related business, it is helpful to separate those with pure exposure to water and those with mixed exposure. Hence, we assign an exposure score of 1.0, 0.5, or 0 for each company, based on its primary business, and select and weight companies based on their exposure score and market capitalization. Hence, the index attempts to provide a balanced, yet reflective view of the global water market by recognizing the full ecosystem of companies and pure-play names to be more focused areas.
RISK/RETURN CHARACTERISTICS
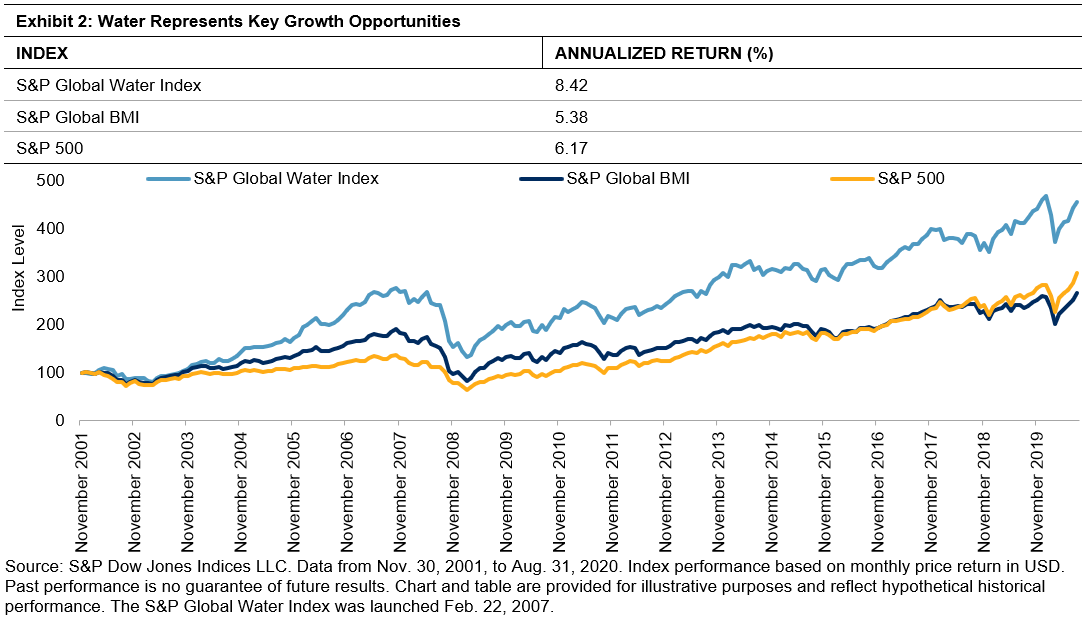
Over a long-term investment horizon, the S&P Global Water Index performed better than the broad-based global equity benchmark, the S&P Global BMI, by 3.04% per year since its inception on Nov. 30, 2001 (see Exhibit 2).
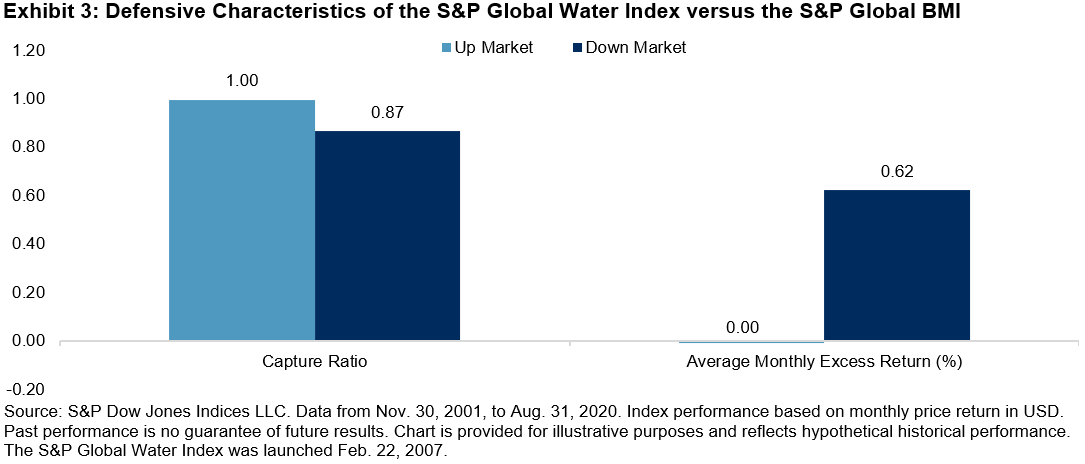
The S&P Global Water Index demonstrated stronger defensive characteristics than the global equities market, with a lower downside capture ratio and higher upside capture ratio (see Exhibit 3).
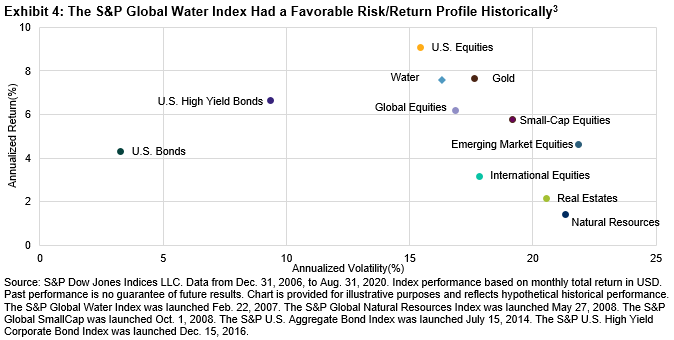
 The S&P Global Water Index also provided favorable risk/return characteristics over the long run compared with key traditional asset classes, including real estate, small-cap equities, international equities, emerging market equities, and gold (see Exhibit 4). The favorable long-term risk/return characteristics compared with the S&P Global Natural Resources Index could be attractive for investors looking to diversify from other natural resource exposure.
For more information on the S&P Global Water Index, please refer to the index methodology and our recently published paper, Investing in Water for a Sustainable Future.
1 “Integrating water stress into corporate bond credit analysis.” UNEP Finance Initiative, Natural Capital Declaration (NCD), Deutsche Gesellschaft für Internationale Zusammenarbeitand (GIZ), and German Association for Environmental Management and Sustainability in Financial Institutions (VfU), 2015, https://www.unepfi.org/publications/ecosystems-publications/integrating-water-stress-into-corporate-bond-credit-analysis/.
2 “The United Nations World Development Report 2015: Water for a Sustainable World.” UNESDOC Digital Library, United Nations Educational, Scientific and Cultural Corporation, 2015, http://unesdoc.unesco.org/images/0023/002318/231823E.pdf.
3 “Water” represents the S&P Global Water Index, “Natural Resources” represents the S&P Global Natural Resources Index, “Global Equities” represents the S&P Global BMI, “U.S. Equities” represents the S&P 500®, “International Equities” represents the S&P Developed Ex-U.S. BMI, “Emerging Market Equities” represents the S&P Emerging BMI, “Small-Cap Equities” represents the S&P Global SmallCap, “U.S. Bonds” represents the S&P U.S. Aggregate Bond Index, “U.S. High Yield Bonds” represents the S&P U.S. High Yield Corporate Bond Index, “Gold” represents the S&P GSCI Gold, and “Real Estate” represents the Dow Jones Global Select Real Estate Securities Index.
The posts on this blog are opinions, not advice. Please read our Disclaimers.Global Diversification in 2020 – Is India Seeing This Opportunity?

The year 2020 has been unique, with the COVID-19 pandemic bringing unprecedented changes to economic activity that no one was fully prepared for, as well as record levels of volatility in financial markets. But such disruption not only creates innovation, it also gives opportunities to contrarian options and allows new themes to emerge dominant.
India has always been a country with a “home bias” in its investment strategies—meaning that Indian investors have generally preferred local securities to global. This is understandable; high yields in the fixed income markets and strong performance from equities, as well as a faith that India would deliver world-beating economic growth, kept investors glued to the local markets. However, the market’s reaction to the events of 2020 have provided a counterpoint to the accepted wisdom, when opportunities beyond domestic borders emerged as the clear winners.
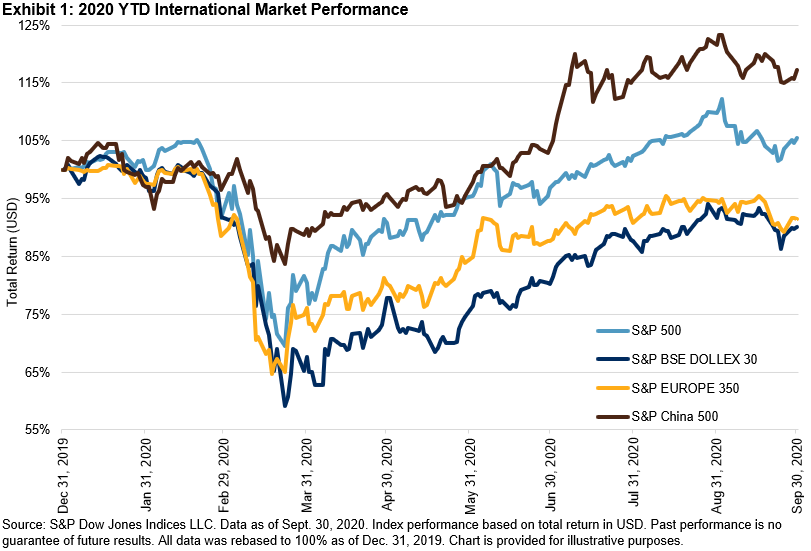
Exhibit 1 compares the YTD trends in the S&P BSE SENSEX with a range of global indices calculated by S&P DJI, including our benchmarks for the U.S., Europe, and China. As the chart makes clear, 2020 has been a year in which global diversification could have helped Indian investors. Note that the S&P BSE DOLLEX 30 is the U.S. dollar equivalent of the Indian rupee-denominated S&P BSE SENSEX; for purposes of comparison, the performance of all indices is shown in U.S. dollars.
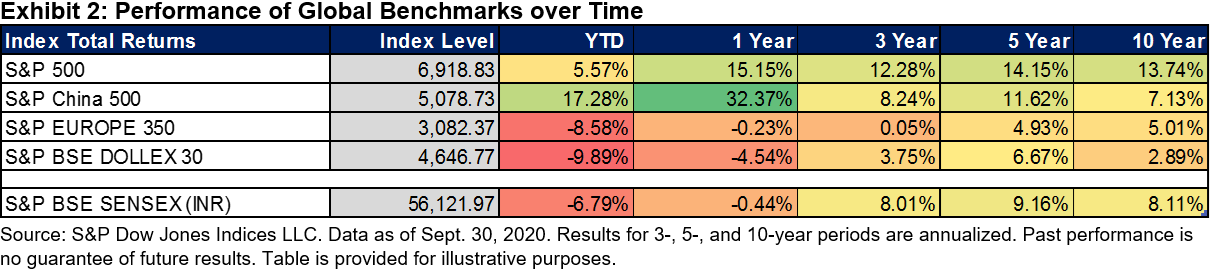
Whenever we compare performance, analyzing different time periods helps understand how the trends played out for a particular investment strategy or rather, in this case, the indices representing the country markets. The case for international diversification for Indian investors also holds up well in the long term, particularly for the world’s largest stock market: the S&P 500’s performance, whether over 1, 3, 5, or 10 years, was distinctly superior.
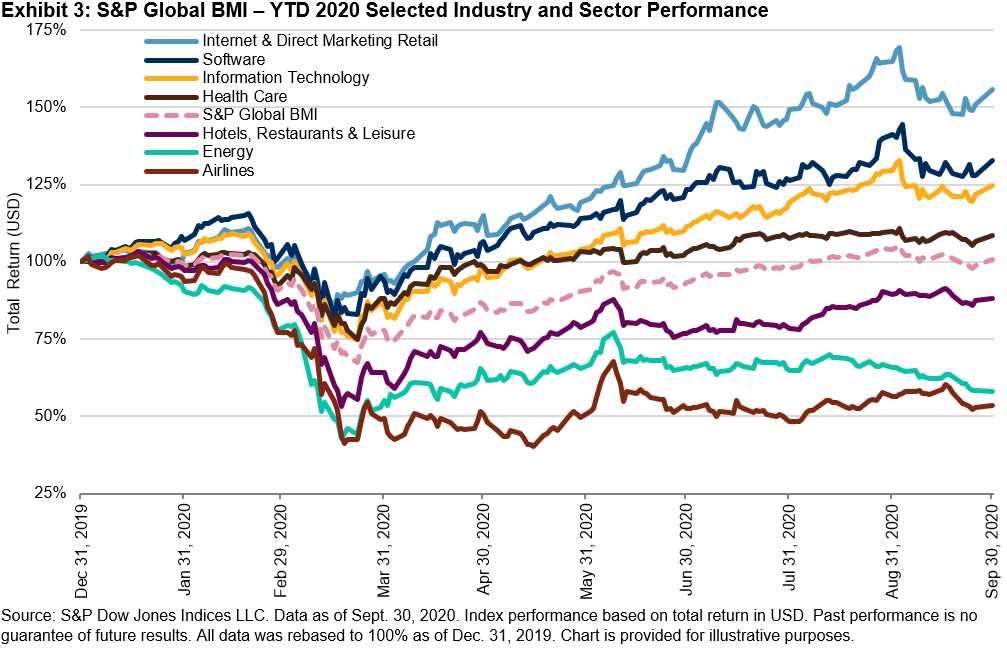
The global opportunity set offers a wide range of sectors and companies—within them, the likes of Microsoft, Apple, Amazon, and Facebook, that have benefited from the move toward virtual workplaces, virtual shopping, and higher spending on communications and technology. Using the S&P Global BMI, Exhibit 3 highlights the performance of certain global equity sectors and industries that showed both substantial gains and declines this year, illustrating the strength of the market’s trends. While airlines and energy companies have seen steep declines across the world, the soaring shares of global software, IT, and internet companies have offered refuge to those who had made an allocation.
International diversification provides local investors the chance to take part in such global trends and participate in the opportunities that arise from advancing technology and global changes in corporate and consumer behavior. Furthermore, in times of turmoil, broader diversification could enable market participants to weather the bad times, along with making the most of the good times.
The extraordinary events of 2020 have so far emphasized the potential of global equities to Indian investors, but are they seeing the opportunity? Offering perspective, S&P Dow Jones Indices’ series of global benchmarks can help frame the landscape of international investing.
Note: Thanks to Tim Edwards for a series of conversations that generated ideas for this blog and for providing some of the accompanying data.
The posts on this blog are opinions, not advice. Please read our Disclaimers.Continued Dominance of Growth Style Investing

Growth style investing has outperformed value for over a decade but its relative returns against value so far in 2020 have been unprecedented: the S&P 500® Growth index boasts its highest-ever year-to-date relative returns (+32%) versus its value counterpart through the third quarter. This comes despite growth’s eight-month winning streak coming to an end in September.

Amid declining interest rates earlier this year and growth companies’ higher sensitivities to discount factors, it is perhaps unsurprising that growth’s year-to-date relative returns have been driven by the outperformance of the most growth-like names in the market. Indeed, the total index market capitalization of “pure growth” S&P 500 companies—those with a growth exposure score of one, meaning they have 100% of their free-float market capitalization allocated to the S&P 500 Growth index—rose by nearly USD 3 trillion in the first three quarters of 2020. This increase was larger than the United Kingdom’s USD 2.2 trillion index market capitalization in the S&P Global BMI at the end of September.
In comparison, the collective index market capitalization of “pure value” companies dropped by USD 1.64 trillion since the end of 2019, and there were declines of USD 0.09 trillion for “middle” companies – those whose capitalization is distributed between the S&P 500 Growth and Value indices.

Much has been written recently about the outperformance of the largest names in the market in 2020, prompting concentration concerns by some market participants. Exhibit 3 shows that the five largest companies in the S&P 500 currently account for around 23% of the index, similar to the levels observed in the 1970s and up from 17% at the end of 2019.

Given that all five of the largest names in the S&P 500 are classified as “pure growth” companies, their outperformance also led to higher concentration in the S&P 500 Growth index. Exhibit 4 shows that the Herfindahl- Hirschman Index (HHI) for the growth index reached an all-time high at the end of August, with the five largest names in the index accounting for nearly 39% of the index. In contrast, the HHI measure for the value index hit an all-time low earlier this year.

For active managers looking to deliver excess returns over the benchmark, elevated index concentrations means having (correct) views over the fortunes of the largest index constituents—and changing allocations accordingly—is more valuable. Results from our Mid-Year 2020 U.S. SPIVA® Scorecard suggest that many active managers correctly identified this year’s growth trends and over-weighted the largest, most growth-like companies in the market: 75% of U.S. large-cap growth equity funds beat the S&P 500 Growth Index over the 12-month period ending June 30, 2020.
In contrast, over 70% of large-cap value managers underperformed the S&P 500 Value index over the same horizon. Much lower levels of index concentration and the more varied reactions of the value index’s constituents amid the “COVID correction” appeared to make it more difficult to identify trends in value.

As a result, the outperformance of the largest, most growth-like names in the market has propelled growth to its record-breaking relative returns compared to value, and appeared to help many growth managers to outperform recently. However, SPIVA results show how difficult it has been for active managers to outperform across the size and style spectrum, especially over longer horizons, and our Fleeting Alpha report shows that past (out)performance is no guarantee of future results. In other words, it is worth remembering that the index advantage is not a coincidence.
The posts on this blog are opinions, not advice. Please read our Disclaimers.Not a Coincidence

We recently issued our mid-year SPIVA® reports for the U.S., Australia, and Europe, and other regions will follow in due course. Although one can sometimes find exceptions in the short run, the long-term results of SPIVA can be easily summarized:
- The majority of active managers underperform most of the time.
- Historical success does not predict future success.
SPIVA continues a line of inquiry that began nearly 90 years ago with the first study of active fund performance versus passive benchmarks. This work accelerated in the 1970s, as the growth of professional portfolio management drew increasing academic interest. Nobel laureate Paul Samuelson was representative of his contemporaries in suggesting that “most portfolio decision makers should go out of business.”
Active managers didn’t take kindly to Samuelson’s suggestion in 1974 and, despite the accumulation of confirming evidence since then, they don’t take kindly to it today either. We’ve estimated that the cumulative cost savings to asset owners just from indexing the S&P 500®, S&P MidCap 400®, and S&P SmallCap 600® amount to better than $300 billion, and every dollar of costs saved by the investor is a dollar of fees not paid to an active manager. So while resentment is to be expected, it’s surprising that critics of SPIVA sometimes focus on its minutiae, rather than on its results.
The most important thing to realize about SPIVA results is that they are not a coincidence. The active management community didn’t lose a cosmic coin flip 90 years ago; active underperformance happens for a set of readily identifiable reasons. These include:
Professionalization. Portfolio management is a zero-sum game; the only source of alpha for the winners is the negative alpha of the losers. When most of the assets in a market are professionally managed, the average professional won’t beat the market because the average professional is the market. It’s not a coincidence that the first index funds were launched in the 1970s; by that point the U.S. equity market had been largely professionalized.
Cost. The expense ratio of the average actively-managed equity mutual fund was 0.74% in 2019; the average index fund cost 0.07%. The average active manager therefore starts out 67 bps in the hole.
Skewness. The distribution of stock returns is skewed—i.e., most stocks underperform the market average. Exhibit 1 illustrates this for the S&P 500.

Of the 1,010 stocks that were part of the S&P 500 between 2000 and 2019, only 267 returned more than average. The probability that a randomly chosen stock would deliver above-average performance, in other words, was 26%, not 50%. When fewer stocks outperform, active management is harder.
These (and other!) reasons are robust and sustainable. Investment management will stay professionalized, active costs will always exceed index costs, and in most years most stocks underperform the average in most markets. The index advantage is likely to persist.
The posts on this blog are opinions, not advice. Please read our Disclaimers.