Get Indexology® Blog updates via email.

In This List

Examining Small-Cap Growth Strategies in Australia

Holding Steady...

What Would Emerging Markets Be Without China?

Comparing Defensive Factors During the Last 3 Bear Markets

Why S&P 500 and DJIA Futures Could Be Useful for Asian Investors during the COVID-19 Selloff

Examining Small-Cap Growth Strategies in Australia

Contributor Image
Arpit Gupta

Former Senior Analyst, Global Research & Design

S&P Dow Jones Indices

Many market participants invest in small-cap equities seeking high-growth potential and portfolio diversification. In this blog, we will examine how growth factors performed in Australian small-cap equities by measuring the hypothetical top-quintile portfolio returns for three growth factors with long- and short-lookback periods, including 12- and 6-month price momentum, 3- and 1-year earnings growth, and 3- and 1-year sales growth based on the S&P/ASX Small Ordinaries index universe.1

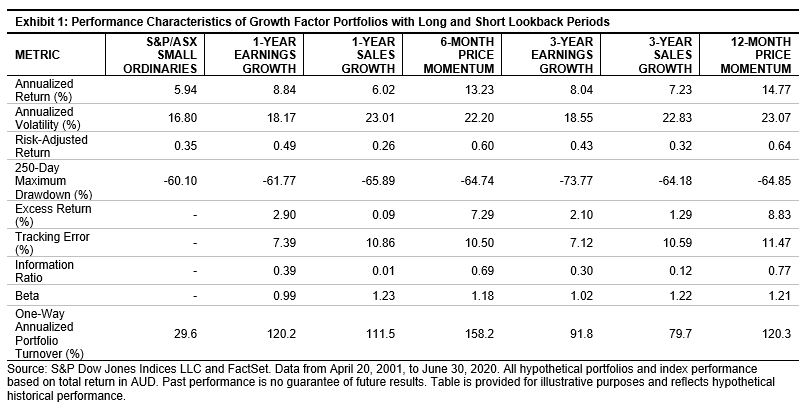
For the period from April 20, 2001, to June 30, 2020, the 12- and 6-month price momentum were the best-performing factors, with 8.83% and 7.29% annualized excess returns, respectively, compared with the S&P/ASX Small Ordinaries (see Exhibit 1). The 3- and 1-year earnings growth factors had relatively modest annualized excess returns of 2.10% and 2.90%, respectively, with a tracking error of nearly 7%, which was the lowest among the other growth factors studied. The 3- and 1-year sales growth factors recorded the smallest annualized excess returns at 1.29% and 0.09%, respectively, compared with the S&P/ASX Small Ordinaries. The earnings growth factor had a beta close to 1, whereas sales growth and momentum had higher betas at 1.2 relative to the S&P/ASX Small Ordinaries.

For the price momentum and sales growth factors, the portfolios with longer lookback periods (12-month price momentum and 3-year sales growth) had higher risk-adjusted returns and information ratios than those of the portfolios with shorter lookback periods (6-month price momentum and 1-year sales growth), though the earnings growth portfolios did not follow the same pattern. Overall, the portfolios with longer lookback periods witnessed lower portfolio turnover. The 3-year earnings growth, 3-year sales growth, and 12-month momentum portfolios recorded one-way annualized portfolio turnovers of 91.8%, 79.7%, and 120.3%, whereas the 1-year earnings growth, 1-year sales growth, and 6-month momentum portfolios had much higher turnover rates of 120.2%, 111.5%, and 158.2%, respectively. Considering the excess returns and replication cost of the portfolios, constructing growth portfolios with longer lookback periods tended to deliver higher returns historically.

Over the period studied, we noticed the outperformance of various growth factors was not consistent across different periods of time (see Exhibit 2). Though momentum was the best-performing factor across the observed horizon, it tended to underperform the S&P/ASX Small Ordinaries and other growth factor portfolios when market regimes transitioned from a bear or time-correction phase to a bull phase. This trend was visible in 2004 (following the war in Iraq), in 2009 after the Global Financial Crisis (GFC), and in 2016 and 2018.

On the other hand, sales growth portfolios did not deliver pronounced excess returns over the entire period, but they tended to perform better during bull markets, which were seen during the pre-GFC period (2006-2007), post-GFC period (2009), and between 2016 and 2019. The sales growth portfolios also had the highest portfolio betas, which accentuated their outperformance during the stock market bull runs.

The earnings growth portfolios had a higher tendency to better perform during market distress, especially in the 3-year earnings portfolio. During the European sovereign debt crisis from 2011-2013, the 3-year earnings growth portfolio delivered pronounced excess returns, and in the recent pandemic crisis (the first half of 2020), both the earnings growth portfolios outperformed the S&P/ASX Small Ordinaries. During volatile periods, market participants may look for safer investments by tilting their portfolios toward profitable companies with robust earnings growth.

From these observations, we conclude that the three growth factor portfolios of price momentum, earnings growth, and sales growth clearly delivered risk premia over the long term in Australian small-cap equities, with the most pronounced excess returns from the price momentum factors, though these growth factors played out differently across changing market regimes over the period studied. We also noted that growth factors with shorter lookback periods did not necessarily deliver better absolute and risk-adjusted returns compared with their respective portfolios with longer lookback periods, but they recorded higher portfolio turnover, hence higher replication costs. This implies that growth factors with longer lookback periods may be more effective for constructing growth factor portfolios in Australian small-cap equities.


1   Z-scores for each of the growth factors are computed for all constituents in the S&P/ASX Small Ordinaries. Companies ranked in the top quintile by their factor z-scores form the respective growth portfolios, which rebalance semiannually on every third Friday of April and October. All portfolios are weighted by their float-adjusted market caps that are tilted by factor z-scores, with individual constituent weights capped at 10%. As earnings and sales growth cannot be evaluated for companies with negative values in the base year, they are ineligible to be part of the earnings and sales growth portfolios.

The posts on this blog are opinions, not advice. Please read our Disclaimers.

Holding Steady...

Contributor Image
Fei Mei Chan

Former Director, Core Product Management

S&P Dow Jones Indices

The market has recovered most of the losses from March’s uproar, with the S&P/TSX Composite Index down 4.8% in 2020 through Sept. 17. Volatility, though off its March peak, continues to be high but has been evenly distributed across all sectors of the market.

Since all sectors experienced similar increases in volatility, it’s not surprising that the latest rebalance for the S&P/TSX Composite Low Volatility Index, effective after the close of trading Sept. 18, 2020, wrought minimal changes.

There were no shifts in sector allocation of more than 2%. What Real Estate gave up went into Financials. Energy experienced the largest spike in volatility, but the index has had no holdings from the sector since three rebalances ago. What is most notable about this rebalance is the perseverance of status quo…which seems to signify the regime change that we observed in April might be sticking around. This trend can be observed in the U.S. market as well.

The posts on this blog are opinions, not advice. Please read our Disclaimers.

What Would Emerging Markets Be Without China?

Contributor Image
Sherifa Issifu

Senior Analyst, U.S. Equity Indices

S&P Dow Jones Indices

In the first decade of the 2000s, the U.S. and other developed countries fell behind emerging market equities by a wide margin, and they lagged China’s markets in particular: the S&P China BMI grew by 600% in the first decade of the new millennium. The 2010s saw a reversal of fortunes for broad-based emerging market equities, with the U.S. leading developed markets to strong outperformance over the decade.

The first quarter of 2020 was marked with record levels of volatility in response to the COVID-19 pandemic, followed by a sharp recovery in the U.S. as the S&P 500® experienced both its shortest bear market and its fastest return to new highs.

But while the S&P 500 is now up a healthy 6% YTD, the S&P Emerging BMI is essentially flat, with a total return in U.S. dollars of -0.06% (as of Sept. 14, 2020). The index’s performance masks a wide dispersion of returns among its constituents: a 53% spread separates the top performer, China, from bottom-of-the-pack Colombia. Few markets have begun the decade with gains: in fact, only China and Taiwan are in the green for 2020.

Thanks in part to such strong recent performance, China has now become as important to the emerging markets as the U.S. is to developed markets, if not even more. China has come to represent nearly 50% of the S&P Emerging BMI by weight—with China’s weight helped by the broader A-shares universe, which was included in the benchmark in 2019 at a partial inclusion factor of 25%.

While China’s role in emerging markets may mimic U.S. dominance of the developed markets, from a sectoral perspective there are both similarities and differences. The U.S.’s sizeable ~27% weighting to the IT sector is its largest, while China’s biggest sectors are Consumer Discretionary and Communication Services—which together account for more than 50% (see Exhibit 4).

However, the differences in sector weights disguise a further commonality: dominating China’s largest sectors, Alibaba and Tencent are, respectively, broadly comparable in both relative size and business activities to Amazon and Alphabet (parent company of Google). These mega-cap tech-related firms have seen large outperformance in comparison to other sectors and the rest of the world, putting them in the driver’s seat of their respective local markets and striking a common chord between the U.S. and Chinese markets.

The path for China in 2020 and beyond remains uncertain. But what is clear is that a view on emerging markets requires careful consideration of the allocation made to—and the prospects for—Chinese stocks. You can learn more about S&P DJI’s range of global equity benchmarks here.

The posts on this blog are opinions, not advice. Please read our Disclaimers.

Comparing Defensive Factors During the Last 3 Bear Markets

Contributor Image
Andrew Neatt

Private Investment Advice

TD Wealth

In the factor world of investing, Low Volatility and Quality have been commonly referred to as defensive factors.  The following is an examination of the performance of the S&P 500 Quality Index and the S&P 500 Low Volatility Index compared to the S&P 500 during the last 3 equity bear markets.  The graphs and data in this report are generated from the Optimal Asset Management’s Factor Allocator Tool.

Before we examine this performance it is important to understand why Quality and Low Volatility have been considered defensive factors.  There are multiple reasons why they have been considered defensive but here are three good reasons.  First of all, they have historically exhibited less volatility as measured by standard deviation on a consistent basis.  The graph below compares the annualized volatitity over the past 1, 3, 5, and 10 year periods ending July 31, 2020 of the S&P 500 Index, S&P 500 Quality Index, and S&P 500 Low Volatility Index.

Another reason is that over the long term, the maximum drawdown of each of these indices has not matched the extent of the maximum drawdown experienced by the S&P 500 as shown in the table below (period examined is from January 3, 1995 to July 31, 2020):

A third reason, on average the S&P 500 Quality Index and the S&P 500 Low Volatility Index have outperformed the S&P 500 during the worst equity market regimes.  To support this point, the following graph shows the average quarterly excess returns of the S&P 500 Quality Index and S&P 500 Low Volatility Index compared to the S&P 500 Index over a variety of market regimes ranging from the worst bear markets to the best bull markets during the period of January 3, 1995 to July 31, 2020.

At the time of writing we are currently at or near all-time highs for the S&P 500 only a few months after the most recent equity bear market low so it is timely to compare the performance of these defensive factors during this year’s equity bear market to the previous two equity bear markets.

Each of the following three bear market comparisons examine the performance over an 18-month period that include similar time frames pre and post equity market low.  For example, the 2002 analysis includes 88 days of recovery after the low of 2002, the 2009 analysis includes 116 days of recovery after the low of 2009, and the 2020 analysis includes 102 days of recovery after the most recent low.

First, the following is a look at the equity bear market of 2002:

Next,  a look at the 2009 equity bear market:

Finally, the most recent bear market:

After examination of these three tables, one can see the consistent reduced volatility associated with the S&P 500 Quality Index and the S&P 500 Low Volatility Index compared to its parent benchmark, the S&P 500 in the past 3 bear markets.  When it comes to returns, the S&P 500 Low Volatility Index and the S&P 500 Quality Index both outperformed in 2002 and 2009.  However, in 2020, while the S&P 500 Quality Index outperformed the S&P 500 again, the S&P 500 Low Volatility Index underperformed.

The posts on this blog are opinions, not advice. Please read our Disclaimers.

Why S&P 500 and DJIA Futures Could Be Useful for Asian Investors during the COVID-19 Selloff

Contributor Image
Izzy Wang

Senior Analyst, Factors and Dividends

S&P Dow Jones Indices

The co-movement of returns that emerged from the interconnection of global markets has important consequences in terms of portfolio hedging and risk management. In our paper, Regional Relevancy of S&P 500® and Dow Jones Industrial Average Futures® in Asia, we highlighted three characteristics of S&P 500 and Dow Jones Industrial Average (DJIA®) futures could potentially be beneficial for Asian investors:

  1. High Liquidity during Asian Trading Hours:1 About USD 27.4 billion in S&P 500 and DJIA futures were traded daily during Asian hours as of June 23, 2020;
  2. High Correlation with Asian Markets: Correlations between U.S. and Asian markets tend to be as high as intraregional correlations in Asia, and they tend to increase during periods of high volatility; and
  3. High Flexibility in Trading: Nearly 24-hour trading and a wide variety of contract sizes allow for precise exposure adjustment at any time.

The high liquidity during Asian trading hours and high correlation with Asian markets could help investors to realize key potential advantages of having U.S. benchmark futures trade during Asian trading hours: being able to react globally to major market news as it happens, hedge against geopolitical uncertainties, and adjust accordingly ahead of economic releases and announcements.

Historically, major market events tend to amplify the liquidity of S&P 500 and DJIA futures, indicating their importance when investors want to react to market news in a timely fashion. On the night of the 2016 U.S. presidential election when U.S. ETF and stock markets were closed, S&P 500 futures traded a notional value of USD 264 billion. This blog provides a recent example of S&P 500 and DJIA futures during an extreme period by focusing on the COVID-19 selloff.

For the whole selloff period from Feb. 19, 2020, to March 23, 2020, the average value traded2 in S&P 500 and DJIA futures was about USD 51.9 billion during Asian trading hours per day (see Exhibit 1). Of note is that on Black Thursday (March 12, 2020), the value traded in S&P 500 futures climbed to USD 77.3 billion during Asian trading hours, which was almost double its average for the selloff period, far exceeding the liquidity traded in the major Asian benchmark futures.

Looking closer at each hour on March 12, 2020 (see Exhibit 2), we can see investors’ immediate reactions to market news through the liquidity of S&P 500 futures. There were two major shocks that largely contributed to Black Thursday. First, when Trump announced a 30-day travel ban against Europe around 9:00 am (Hong Kong/Singapore Time), there was a boost in the value traded of S&P 500 futures. Then later that day, when the ECB made it clear it would not cut interest rates, the value traded in S&P 500 futures increased significantly alongside the effect of the U.S. market open.

The high level and substantial increase in liquidity during major market events suggests the importance of S&P 500 and DJIA futures as one of the most popular instruments for investors to react timely to market news. Combined with the nearly 24-hour trading and a wide variety of contract sizes, market participants in Asia can potentially hedge and manage risk effectively using a single liquid U.S. index derivative instrument.

1 For the purposes of this paper, Asian trading hours are defined as 8:00 a.m. to 5:00 p.m. Singapore/Hong Kong time.

2 The daily value traded associated with each futures trade is calculated as the number of contracts traded per day times the futures VWAP price per day times the contract size.

The posts on this blog are opinions, not advice. Please read our Disclaimers.