Get Indexology® Blog updates via email.

In This List

Gold and U.S. Treasuries Helped the S&P MARC 5% Index Performance YTD

Cyclones and Cyclicals

Bringing ESG to Australia’s Core

Dow Jones Industrial Average: 124 Years and It Keeps Changing

Will Powell Power the Aristocrats?

Gold and U.S. Treasuries Helped the S&P MARC 5% Index Performance YTD

Contributor Image
Karina Tjin

Former Analyst, Strategy Indices

S&P Dow Jones Indices

Despite substantial market volatility and significant drawdowns in the first quarter of 2020, the S&P MARC 5% Index ended the quarter in positive territory (see The Importance of Asset Class Diversification: A Performance Analysis of the S&P MARC 5% Index). With markets staging impressive rebounds, we take a renewed look at the performance of the S&P MARC 5% Index on a YTD basis.

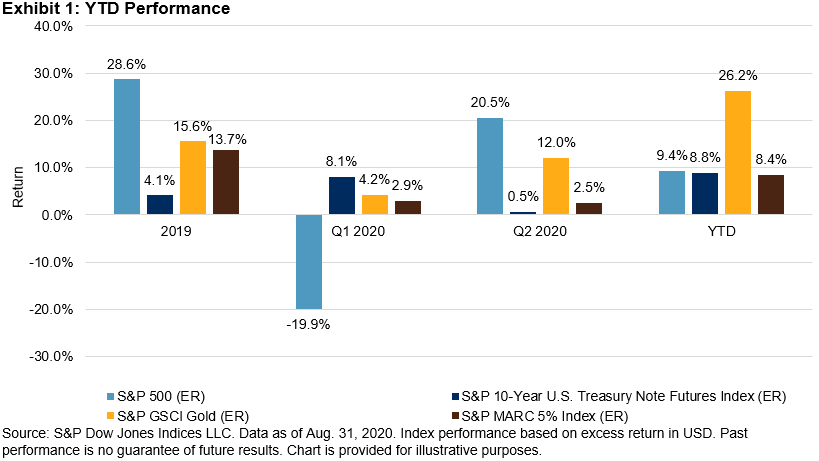
Exhibit 1 shows that the S&P MARC 5% Index had similar returns in Q2 2020 (2.5%) as it did in the first quarter (2.9%). The index returned 8.4% through the end of August 2020.

The underlying components that make up the index are equities, U.S. Treasuries, and gold. Equities (S&P 500®) ended Q1 2020 down 19.9%, but bounced back in Q2 2020 to return 20.5%. Through the end of August 2020, equities returned 9.4%. While the performance of the S&P 10-Year U.S. Treasury Note Futures Index in Q2 2020 dropped compared with that of Q1 2020, it still delivered a YTD return of 8.8%. With more investors turning to gold, the S&P GSCI Gold posted positive returns throughout the year, with an impressive 26.2% return YTD—which is the second-highest annual return (YTD) in the past 10 years.

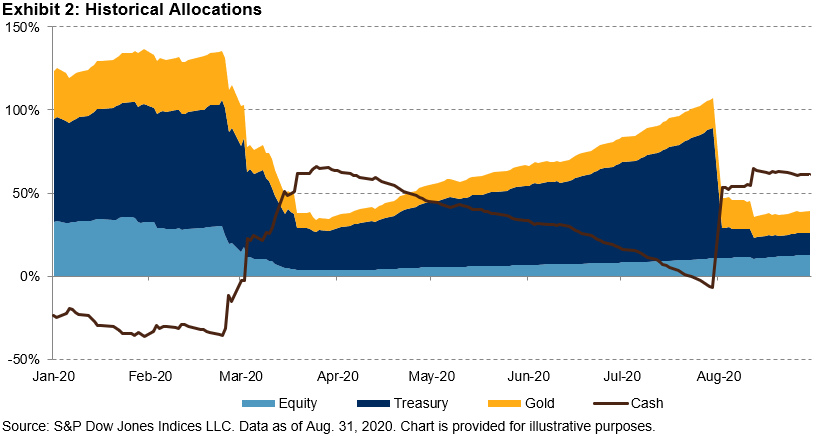
Looking at the underlying asset allocations, the S&P MARC 5% Index allocated over 100% all together to cash, gold, and U.S. Treasuries in Q1 2020 (see Exhibit 2), with an average allocation of 22.5% to equities, 57.6% to U.S. Treasuries, and 23.8% to gold. As volatility picked up in March 2020, the total asset allocation dropped quickly to less than 50% in order to meet the index’s 5% volatility target.

Following March 2020, allocations remained subdued throughout Q2, particularly for the riskiest asset class, equities. On average, the index allocated 6.0% to equities, 42.0% to U.S. Treasuries, and 11.1% to gold in Q2 2020. However, during the last week of July 2020, the index resumed using leverage and allocated over 100%, demonstrating its ability to react quickly to changing market conditions. We note that the index’s recent performance was mainly driven by its allocation to gold and U.S. Treasuries, as its allocation to equities has continued to remain low.

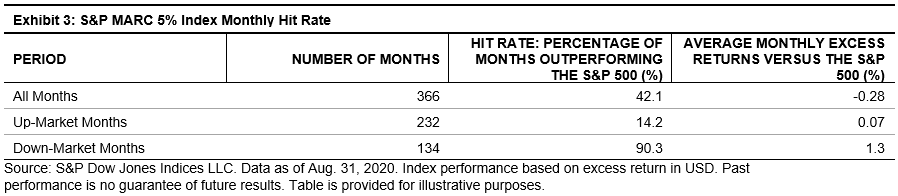
Comparing the S&P MARC 5% Index to the broader market historically, it outperformed the S&P 500 in 14.2% of up-market months and 90.3% of down-market months (see Exhibit 3). In addition, during those down-market months, the index outperformed the S&P 500 on average by 1.3%. The strong performance in down-market months seems to be attributable to the index allowing dynamic allocation shifts in order to maintain the volatility target in times of high volatility.

The posts on this blog are opinions, not advice. Please read our Disclaimers.

Cyclones and Cyclicals

Contributor Image
Jim Wiederhold

Former Director, Commodities and Real Assets

S&P Dow Jones Indices

Most constituents of the S&P GSCI posted positive performance in August. The headline S&P GSCI rose 4.59% on the back of increased inflation expectations and bullish market sentiment brought on by the S&P 500® reaching new highs. The performance attribution across sectors was evenly distributed. Inflation hedging may have been one of the key drivers in commodities outperformance this month, following changes to the U.S. Federal Reserve inflation target, which allows inflation to run above 2% and gives the Fed more leeway to cut its interest rate in the event of an economic shock. Commodities tend to perform well in inflationary environments.

The S&P GSCI Energy rose 5.41%, continuing its positive performance from the prior month. Cooling needs due to hot weather and the summer driving season were big influences on the energy sector. The S&P GSCI Natural Gas rose 37.40% and the S&P GSCI Unleaded Gasoline rose 8.81%. A category 4 hurricane in the Gulf of Mexico caused oil rig shutdowns and short-term supply disruptions. Energy commodities benefitted from a catch up in demand and signs of a slight return to normal in economic activity, after the dire situation the U.S. experienced in Q2 this year.

The S&P GSCI Industrial Metals rose 5.20% in August and moved into positive territory YTD, at 3.17%. Industrial metals benefitted from a focus on electric vehicles and further improvement in China’s August PMI to 54.5 from 54.1. Inputs to Tesla vehicles such as aluminum, copper, and nickel were bid up, as bullish sentiment behind the company propelled it higher.

The positive backdrop for the S&P GSCI Silver continued into August with a 17.15% gain and now a 55.08% YTD return. The positive consensus for industrials was the biggest driver for silver, while the S&P GSCI Gold consolidated after marking new all-time highs earlier in the month.

Sustained buying of U.S. grains by China and positive energy sector performance buoyed the S&P GSCI Agriculture in August. The S&P GSCI Corn rose 8.80%, reversing its negative performance from July. Within the S&P GSCI Softs, the S&P GSCI Cocoa pushed into positive territory YTD and gained 11.13% for the month. The Ivory Coast-Ghana Initiative was created, and a minimum price floor was introduced to address the disparity between farmers’ incomes and commodity traders. The two countries have coordinated before in the cocoa market, but this is the first formal undertaking.

The S&P GSCI Lean Hogs rose 8.02% in August, aided by continued buying from China and low levels of pork in cold storage. It has been one of the hardest hit commodities of 2020, down 47.35% YTD.

The posts on this blog are opinions, not advice. Please read our Disclaimers.

Bringing ESG to Australia’s Core

The launch of the S&P/ASX 200 ESG Index provides a transparent, rules-based foundation for market participants looking to reinforce their core while aligning investment objectives with their ESG values. S&P DJI’s Stuart Magrath joins SSGA’s Meaghan Victor to explore the data powering this innovative index and how its ESG framework influences risk/return.

Learn More: www.spglobal.com/spdji/since-2000

The posts on this blog are opinions, not advice. Please read our Disclaimers.

Dow Jones Industrial Average: 124 Years and It Keeps Changing

Contributor Image
Howard Silverblatt

Senior Index Analyst, Product Management

S&P Dow Jones Indices

S&P Dow Jones Indices (S&P DJI) announced major changes to the 124-year-old Dow Jones Industrial Average® (The Dow®), effective on the same day (Aug. 31, 2020) as Apple’s (AAPL) four-for-one stock split. Specifically, Salesforce.com (CRM) will replace Exxon Mobil (XOM), Amgen (AMGN) will replace Pfizer (PFE), and Honeywell International (HON) will replace Raytheon Technologies (RTX).

Issue reviews are constant in The Dow, with any change having its own investment rationale and impact. However, last month, Apple, the largest-weighted issue in the index, announced a four-for-one stock split, which would effectively change its weight in The Dow from 12.20% to 3.36%, increasing the weight of the other 29 members by 10.1% each and reducing the weight of the Information Technology sector from 27.63% to 20.35%. This action was a catalyst for the changes S&P DJI made, as it continues to align the index with the shifting nature of the U.S. economy.

The most notable change was the removal of Exxon Mobil, which was added to The Dow in 1928 as Standard Oil of New Jersey, when The Dow increased its membership from 20 to the current 30. The Energy sector has been experiencing a shrinking footprint in the marketplace. Exxon Mobil’s removal will leave Chevron (CVX; added to the Dow in 1924 as Standard Oil of California) representing the sector, with a weight of 2.07% (pre-changes, the two had a weight of 3.14%). The addition of Salesforce.com will help diversify the Information Technology exposure to application software and will make up for some of the reduction in weighting due to the Apple split (from 27.63% down to 20.35% for the split, then up to 23.07% after the membership changes).

Pfizer was the lowest-priced issue in the index (and therefore had the lowest weighting) and is planning to spin off its generic drug business, which would reduce its price and weight. Amgen is one of the largest issues in the biotechnology field and is seen as broadening The Dow’s exposure to Health Care (currently 14.2% and 18.6% after the changes).

United Technologies (UTX) completed its spin-off of Carrier (CARR) and Otis Worldwide (OTIS), which were added to the S&P 500®, and merged with Raytheon (RTN) to form Raytheon Technologies, which is concentrated in the Aerospace and Defense (A&D) industry. Given Boeing’s (BA) representation in the A&D area, Honeywell International (which was originally Allied Chemical and was added to The Dow in 1925 and removed in 2008) was seen as diversifying the Industrials sector.

The bottom line is that the marketplace is always changing, and market barometers need to change with it. Each of the changes reflects the environmental changes of the economy and is not intended as a buy-sell indicator, but as a “that’s the way it is” reflection of the market.

The posts on this blog are opinions, not advice. Please read our Disclaimers.

Will Powell Power the Aristocrats?

Contributor Image
Chris Bennett

Former Director, Index Investment Strategy

S&P Dow Jones Indices

As the recovery from the Global Financial Crisis edged forward in the early 2010s, inflation hawks warned about the “certainty” of an imminent spike in inflation following the aggressive stimulus measures taken by global central banks. Unfortunately for the U.S. Federal Reserve and some of its other monetary counterparts, that certainty never materialized, and it then spent the better part of the next decade attempting to stoke what was once thought to be a sure thing.

Today, following another crisis and subsequent monetary rescue, the inflation hawks are back, as is uncertainty around the path forward for inflation. Despite massive stimulus and a spike to the money supply earlier this year, the 10-Year Breakeven Inflation Rate is right around where it was to start 2020 (1.72% on Aug. 26, 2020, versus 1.77% on Dec. 31, 2019), 30 bps below the Fed’s previous 2% long-term inflation target.

Movement in real asset prices has also sparked inflation fears. The S&P GSCI Gold, for example, was up 25% YTD as of Aug. 26, 2020, though the underlying dynamics likely extend far beyond a potential jump in inflation—gold’s rise also reflects general market fears of economic uncertainty and the sharp decline in bond yields we’ve seen already this year. To pick a commodity somewhat esoteric for the financial markets, but most decidedly “real,” lumber prices have also soared in the past four months, and recently reached record highs on the back of a surge in new home sales.

To help combat the inflationary uncertainty, on Aug. 27, 2020, Fed Chairman Jerome Powell unveiled a new direction for the central bank’s travel: average inflation targeting. This approach would allow the Fed to monitor inflation over longer periods of time and set policy based on where inflation has been on average, rather than where inflation is today. In practice, this means that should inflation rise, the Fed would likely let it run above its 2% annual target for some time before enacting contractionary measures. If the Fed’s policies have the effect of suppressing yields across the fixed income markets even as inflation begins to rise, perhaps investors could be disposed to take a second look at the equity markets for reliable income.

If they do, they might be wise to discern between companies that can maintain a steady stream of cash payouts to shareholders, and those that (perhaps due to a collapse in price) have a high dividend yield. The S&P Dividend Aristocrats® Indices are designed to track the performance of companies with a long history of maintaining or increasing their dividends per share, and that accordingly might be hoped to continue to do so. While those stocks classified as “Aristocrats” are not always those with the highest dividends, the yields on this series of indices can also be quite chunky: the S&P Global Dividend Aristocrats, for example, boasts a 6.2% yield.

Though the future for inflation is uncertain, bond yields could be lower for longer even if inflation picks up. For investors seeking income, perhaps it is time to give the equity markets a second look, and to let the Fed power your entry into the Aristocracy.

The posts on this blog are opinions, not advice. Please read our Disclaimers.