Get Indexology® Blog updates via email.

In This List

Dow Jones Industrial Average: 124 Years and It Keeps Changing

Will Powell Power the Aristocrats?

A Stable Regime

Recalled to Life: The S&P SmallCap 600’s Persistent Outperformance after the Russell Reconstitution

Factoring Inflation Into Retirement Planning

Dow Jones Industrial Average: 124 Years and It Keeps Changing

Contributor Image
Howard Silverblatt

Senior Index Analyst, Product Management

S&P Dow Jones Indices

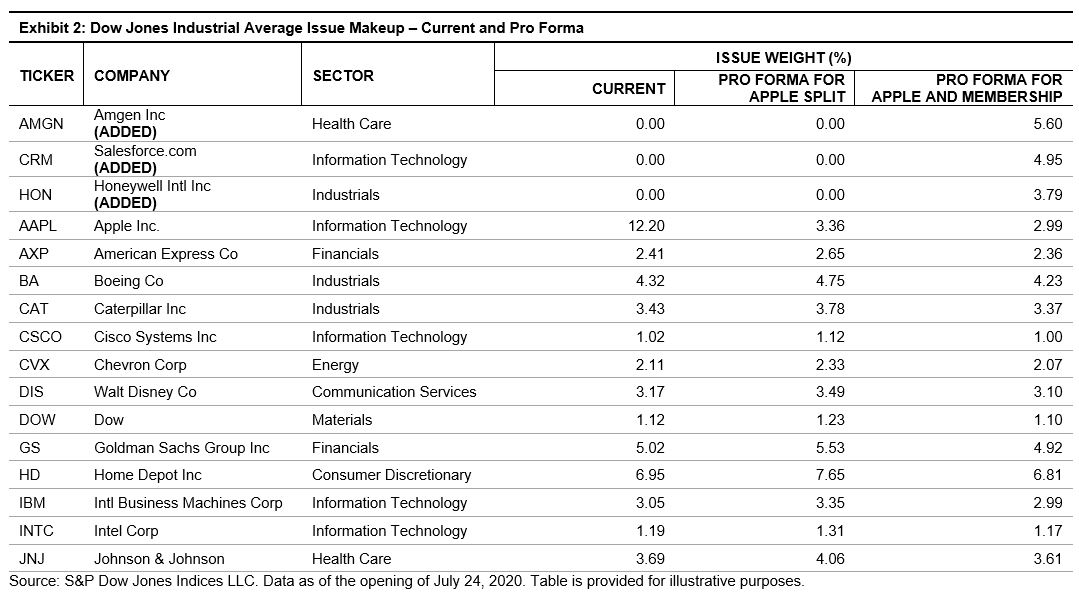
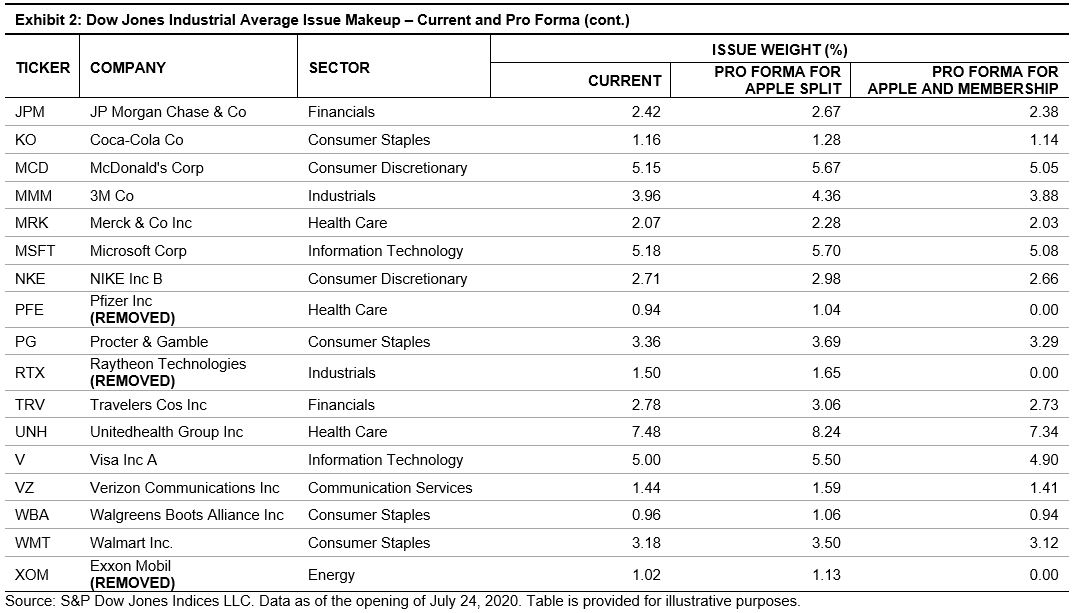
S&P Dow Jones Indices (S&P DJI) announced major changes to the 124-year-old Dow Jones Industrial Average® (The Dow®), effective on the same day (Aug. 31, 2020) as Apple’s (AAPL) four-for-one stock split. Specifically, Salesforce.com (CRM) will replace Exxon Mobil (XOM), Amgen (AMGN) will replace Pfizer (PFE), and Honeywell International (HON) will replace Raytheon Technologies (RTX).

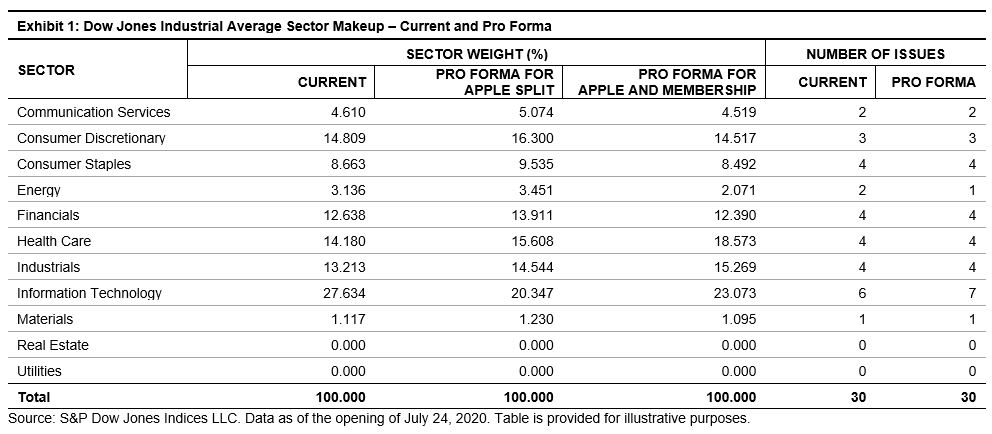
Issue reviews are constant in The Dow, with any change having its own investment rationale and impact. However, last month, Apple, the largest-weighted issue in the index, announced a four-for-one stock split, which would effectively change its weight in The Dow from 12.20% to 3.36%, increasing the weight of the other 29 members by 10.1% each and reducing the weight of the Information Technology sector from 27.63% to 20.35%. This action was a catalyst for the changes S&P DJI made, as it continues to align the index with the shifting nature of the U.S. economy.

The most notable change was the removal of Exxon Mobil, which was added to The Dow in 1928 as Standard Oil of New Jersey, when The Dow increased its membership from 20 to the current 30. The Energy sector has been experiencing a shrinking footprint in the marketplace. Exxon Mobil’s removal will leave Chevron (CVX; added to the Dow in 1924 as Standard Oil of California) representing the sector, with a weight of 2.07% (pre-changes, the two had a weight of 3.14%). The addition of Salesforce.com will help diversify the Information Technology exposure to application software and will make up for some of the reduction in weighting due to the Apple split (from 27.63% down to 20.35% for the split, then up to 23.07% after the membership changes).

Pfizer was the lowest-priced issue in the index (and therefore had the lowest weighting) and is planning to spin off its generic drug business, which would reduce its price and weight. Amgen is one of the largest issues in the biotechnology field and is seen as broadening The Dow’s exposure to Health Care (currently 14.2% and 18.6% after the changes).

United Technologies (UTX) completed its spin-off of Carrier (CARR) and Otis Worldwide (OTIS), which were added to the S&P 500®, and merged with Raytheon (RTN) to form Raytheon Technologies, which is concentrated in the Aerospace and Defense (A&D) industry. Given Boeing’s (BA) representation in the A&D area, Honeywell International (which was originally Allied Chemical and was added to The Dow in 1925 and removed in 2008) was seen as diversifying the Industrials sector.

The bottom line is that the marketplace is always changing, and market barometers need to change with it. Each of the changes reflects the environmental changes of the economy and is not intended as a buy-sell indicator, but as a “that’s the way it is” reflection of the market.

The posts on this blog are opinions, not advice. Please read our Disclaimers.

Will Powell Power the Aristocrats?

Contributor Image
Chris Bennett

Former Director, Index Investment Strategy

S&P Dow Jones Indices

As the recovery from the Global Financial Crisis edged forward in the early 2010s, inflation hawks warned about the “certainty” of an imminent spike in inflation following the aggressive stimulus measures taken by global central banks. Unfortunately for the U.S. Federal Reserve and some of its other monetary counterparts, that certainty never materialized, and it then spent the better part of the next decade attempting to stoke what was once thought to be a sure thing.

Today, following another crisis and subsequent monetary rescue, the inflation hawks are back, as is uncertainty around the path forward for inflation. Despite massive stimulus and a spike to the money supply earlier this year, the 10-Year Breakeven Inflation Rate is right around where it was to start 2020 (1.72% on Aug. 26, 2020, versus 1.77% on Dec. 31, 2019), 30 bps below the Fed’s previous 2% long-term inflation target.

Movement in real asset prices has also sparked inflation fears. The S&P GSCI Gold, for example, was up 25% YTD as of Aug. 26, 2020, though the underlying dynamics likely extend far beyond a potential jump in inflation—gold’s rise also reflects general market fears of economic uncertainty and the sharp decline in bond yields we’ve seen already this year. To pick a commodity somewhat esoteric for the financial markets, but most decidedly “real,” lumber prices have also soared in the past four months, and recently reached record highs on the back of a surge in new home sales.

To help combat the inflationary uncertainty, on Aug. 27, 2020, Fed Chairman Jerome Powell unveiled a new direction for the central bank’s travel: average inflation targeting. This approach would allow the Fed to monitor inflation over longer periods of time and set policy based on where inflation has been on average, rather than where inflation is today. In practice, this means that should inflation rise, the Fed would likely let it run above its 2% annual target for some time before enacting contractionary measures. If the Fed’s policies have the effect of suppressing yields across the fixed income markets even as inflation begins to rise, perhaps investors could be disposed to take a second look at the equity markets for reliable income.

If they do, they might be wise to discern between companies that can maintain a steady stream of cash payouts to shareholders, and those that (perhaps due to a collapse in price) have a high dividend yield. The S&P Dividend Aristocrats® Indices are designed to track the performance of companies with a long history of maintaining or increasing their dividends per share, and that accordingly might be hoped to continue to do so. While those stocks classified as “Aristocrats” are not always those with the highest dividends, the yields on this series of indices can also be quite chunky: the S&P Global Dividend Aristocrats, for example, boasts a 6.2% yield.

Though the future for inflation is uncertain, bond yields could be lower for longer even if inflation picks up. For investors seeking income, perhaps it is time to give the equity markets a second look, and to let the Fed power your entry into the Aristocracy.

The posts on this blog are opinions, not advice. Please read our Disclaimers.

A Stable Regime

Contributor Image
Fei Mei Chan

Former Director, Core Product Management

S&P Dow Jones Indices

In recent days the S&P 500 reached multiple new highs, despite the still-uncertain nature of the economy’s recovery from the COVID-19 pandemic. Year to date through Aug. 20, 2020, the S&P 500 is up 6% while the S&P 500 Low Volatility Index is down 6%.

Market volatility remains high, as evidenced by the charts in Exhibit 1. In all sectors of the S&P 500, volatility spiked in March and, though it has leveled off, remains above average. Similar to three months ago, Energy and Financials were among the sectors with the greatest volatility increase.

It’s not surprising to see that there were only minute shifts in sector allocations for the latest rebalance in the S&P 500 Low Volatility Index (effective after market close Aug. 21). With just 11 names cycling through the index, turnover was well below average. Weights in Energy and Financials continue to be depressed relative to the S&P 500. Notably, since the rebalance in May, Technology has had a higher weighting than Utilities, an occurrence that has only happened once, very briefly, since 1991. It seems the new regime that caused big sector shifts in the previous rebalance is, at the moment, here to stay.

The posts on this blog are opinions, not advice. Please read our Disclaimers.

Recalled to Life: The S&P SmallCap 600’s Persistent Outperformance after the Russell Reconstitution

Contributor Image
Berlinda Liu

Former Director, Multi-Asset Indices

S&P Dow Jones Indices

S&P DJI’s paper, A Tale of Two Benchmarks (first published in in 2009 and later updated in 2015 and 2019), showed that the S&P SmallCap 600® has structurally outperformed the Russell 2000, primarily benefiting from S&P DJI’s index inclusion criteria for profitability, liquidity, and public float. The paper also delves deeper into several secondary attribution analyses, including one of the most well-known market anomalies: the excess returns around the Russell reconstitution, which we’ll explore more deeply here.

As a brief review, index modifications to the S&P 500®, S&P MidCap 400®, and S&P SmallCap 600 are driven by changes in companies’ size, free float, corporate actions, new IPOs, and meeting inclusion criteria. These are constantly monitored by the Index Committee, and index changes are made throughout the year on an as-needed basis.1

In contrast, the Russell indices originally rebalanced on a quarterly basis, then on a semiannual basis, before moving to the current annual rebalance in 1989. In response to long-standing criticism regarding excessive turnover and significant price volatility on the rebalance day, starting in 2004, Russell published provisional indices, moved the day of the annual rebalance within June, and used NASDAQ’s (then-new) Closing Cross mechanism for determining effective prices.2 Later changes included quarterly IPO additions.

However, these changes failed to address the underlying inefficiency stemming from potential front-running of the rebalance trade that remains a several months-long process. Rather than disentangle the complex pre-inclusion effects, we’ll focus on what happens after the rebalance, as this is of most relevance to passive index portfolios.

Exhibit 2A shows the differences in the average monthly returns of the S&P SmallCap 600 and the Russell 2000. The particularly notable average July outperformance of the S&P SmallCap 600 is 0.64% (t-stat = 2.92), as components entering the Russell 2000 at artificially elevated levels mean-revert. As a result, the S&P SmallCap 600 has outperformed the Russell 2000 in July for 19 of the 27 years observed (70.4%).

This reversion does not happen instantly on one trading day either, as would happen for a momentary closing imbalance. Just as the reconstitution is in reality a several months-long process, the unwind has a long tail. Exhibit 3 illustrates the excess returns measured from the rebalance date to selected intervals afterward. While the dislocations have been less extreme in recent years, especially closer to the reconstitution date, a conspicuous gap persisted and continued to widen even after one month.

While fundamental index construction factors have contributed significantly to the S&P SmallCap 600’s persistent outperformance versus the Russell 2000, the annual reconstitution continues to drive a secondary trading-driven inefficiency every July. Passive index portfolios often show little tracking error to the benchmark in the era of hyper-liquid markets and low commissions, but may still regularly pay these invisible costs to arbitragers based on their choice of index.

1 It is important to note that these indices (and the committee) seek to reflect the U.S. equity market in its entirety, including sector coverage, rather than mechanically select the largest companies in order. For more details, please refer to the S&P U.S. Indices Methodology.

2 Matturri, Alex, “2004 Russell Reconstitution Recap,” Northern Trust, July 2004.

The posts on this blog are opinions, not advice. Please read our Disclaimers.

Factoring Inflation Into Retirement Planning

How might inflation impact retirement income? S&P DJI’s Hamish Preston, DFA’s Grady Smith, and DCIIA Retirement Research Center’s Warren Cormier discuss.

Learn More: https://www.spglobal.com/spdji/en/documents/performance-reports/dashboard-sp-stride.pdf


The posts on this blog are opinions, not advice. Please read our Disclaimers.