Get Indexology® Blog updates via email.

In This List

Gold’s Time to Shine

Higher Turnover Ahead For S&P 500? Not Necessarily!

Exploring SPIVA on a Risk-Adjusted Basis

Increased Supply of U.S. Treasuries and Interest Rate Risk

S&P Pure Growth Indices – Attributes and Performance Drivers

Gold’s Time to Shine

Contributor Image
Jim Wiederhold

Former Director, Commodities and Real Assets

S&P Dow Jones Indices

The first half of 2020 has been gold’s time to shine. The double-digit YTD gains outpaced equities and other safe-haven assets during these uncertain recessionary times. As of May 29, 2020, the S&P GSCI Gold was up 13.94% YTD. Unprecedented global fiscal and monetary stimulus measures have significantly increased sovereign debt levels, leading to concerns of currency devaluation. Historically, such environments have been constructive for gold as a globally recognized store of value. Low to negative global real yields and gold’s low correlation to other assets add to the positive catalysts in the current environment.

It has not been an entirely smooth ride this year, with some volatility along gold’s path to outperformance, as was highlighted in a blog by Fiona Boal. A rhyming pattern appeared along the lines of the 2008 Global Financial Crisis, in which a need for liquidity forced market participants to sell gold holdings before reloading and returning gold back to an upward trend (see Exhibit 2).

This year’s backdrop of the potential for a pandemic-induced global recession comes as the China-U.S. trade war restarts. There is a deglobalization of supply chains, creating a less-inclusive global economy. Uncertainty in the near term seems to be the only certainty in 2020.

This year is also different from a demand perspective as it relates to gold. According to the World Gold Council, first quarter 2020 jewelry demand was the lowest in over 10 years, while first quarter investment demand was the highest since the first quarter of 2016 (see Exhibit 3). Preliminary data suggests the second quarter of 2020 is shaping up to be a continuation of this trend, with reduced consumer spending on non-essential jewelry purchases combined with record flows into gold exchange-traded products.

As of May 29, 2020, the S&P Commodity Producers Gold Index returned 16% YTD. The environment is particularly attractive for these companies, with potential M&A activity ahead due to fewer large-scale discoveries of gold deposits. Once discovered, it can take 15 years to reach successful ore production. Fewer discoveries and near-term mine suspensions by governments due to COVID-19 make the precious metal that much scarcer. There was a fifth consecutive quarterly decline in global gold mining prior to any of the recent pandemic-related shutdowns.

In 2019, S&P Dow Jones Indices launched a 70% futures and 30% gold equities blended index, the S&P GSCI Gold Dynamic Roll 70/30 Futures/Equities Blend, to allow participation in the gold market across asset classes. We also offer many additional gold-related indices to meet the needs of market participants. To learn more, visit https://spdji.com/landing/investment-themes/commodities.

The posts on this blog are opinions, not advice. Please read our Disclaimers.

Higher Turnover Ahead For S&P 500? Not Necessarily!

Contributor Image
Hamish Preston

Head of U.S. Equities

S&P Dow Jones Indices

The emergence of COVID-19 caused sizeable recalibrations in financial markets as investors grappled with the anticipated impacts on people’s lives and on economic activity.  Given many companies saw significant drops in market capitalizations amid the recent market sell-off, and in light of expectations for companies’ earnings to suffer from reduced economic activity, some may be wondering if we will soon see elevated S&P 500 turnover.

While I have no knowledge of what (if any) constituent changes may be made going forward – I do not sit on the S&P U.S. Index Committee, which is responsible for the S&P 500, S&P MidCap 400, and the S&P SmallCap 600 indices – the topic of higher potential turnover in the COVID-19 era highlights the importance of understanding index construction.

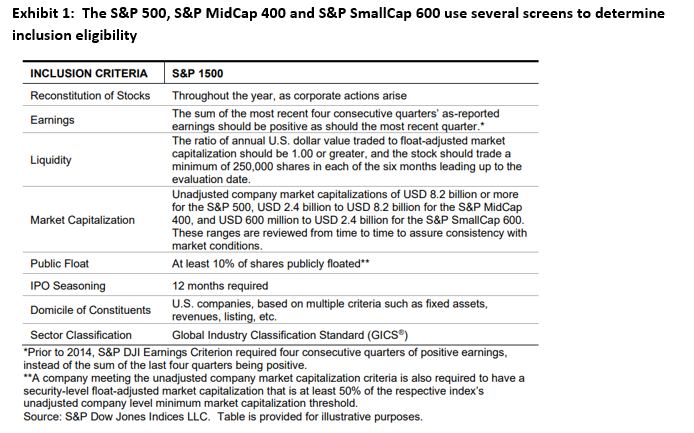
The reason some people may believe higher S&P 500 turnover beckons is that our U.S. Index Committee uses several screens when determining companies’ eligibility for index inclusion.  For example, companies must have a history of positive earnings and must meet certain capitalization thresholds.

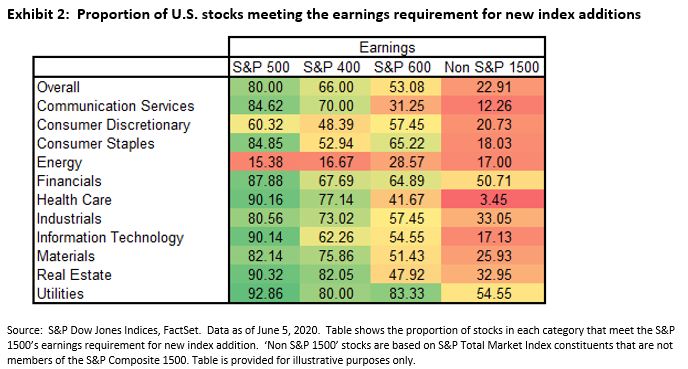
Given the aforementioned anticipated impact on companies’ earnings, it is perhaps unsurprising to see several constituents of the S&P 500, S&P 400, and S&P 600 (collectively, the S&P 1500) would not meet the earnings requirement.  Energy companies’ earnings were particularly hard hit from the headwinds in commodity markets earlier this year.

But before anyone uses exhibit 2 to infer substantial turnover in S&P U.S. equity indices lies ahead, it is important to recognize that the inclusion criteria outlined in Exhibit 1 are for NEW additions to the various components of the S&P Composite 1500.  It is also worth noting that many U.S. companies that are currently not members of the S&P 1500 do not currently meet the earnings requirement, and so are not currently eligible for index addition.

Notwithstanding the fact that many companies are ineligible for index addition, the U.S. Index Committee considers other factors – such as turnover, corporate actions, and market representation – when deciding on constituent changes to the indices. This is highlighted in the S&P U.S. Equity Indices Methodology document; exhibit 3 is a statement from the methodology document outlining the Index Committee’s commitment to minimizing turnover.

As a result, while we will have to wait and see what changes (if any) are made to index constituents, the construction of S&P U.S. Equity Indices’ indicates the recent market environment may not necessarily lead to higher turnover.  Combined with the historical benefit of the S&P U.S. Index Committee making constituent changes on an ongoing, as needed basis rather than on a set reconstitution date – S&P U.S. equity indices typically exhibited lower turnover compared to alternative measures of large, mid, and small cap U.S. equities – market participants may wish to remember the importance of index construction.

The posts on this blog are opinions, not advice. Please read our Disclaimers.

Exploring SPIVA on a Risk-Adjusted Basis

What happens to active manager performance when risk is factored in? S&P DJI’s Gaurav Sinha takes a closer look at SPIVA data from markets around the globe.

Read the full report: https://spdji.com/indexology/core/spiva-through-a-risk-adjusted-lens

The posts on this blog are opinions, not advice. Please read our Disclaimers.

Increased Supply of U.S. Treasuries and Interest Rate Risk

Contributor Image
Hong Xie

Former Senior Director, Global Research & Design

S&P Dow Jones Indices

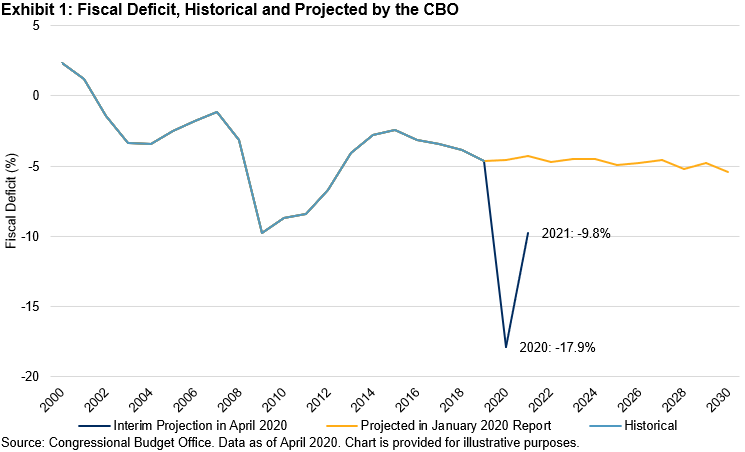
Since March 2020, the federal government has enacted four pieces of legislation to assist businesses and individuals weather the economic downtown triggered by the COVID-19 outbreak. According to the Congressional Budget Office (CBO), these four pandemic-related laws are projected to increase the federal deficit by USD 2.2 trillion in fiscal year 2020 and by USD 0.6 trillion in fiscal year 2021. Those amounts would represent 11% of nominal GDP in fiscal year 2020 and 3% in fiscal year 2021. In late April 2020, the CBO adjusted the projected deficit to be 17.9% of GDP in 2020 and 9.8% in 2021, figures that were 13.3% and 5.5% higher, respectively, than projected in the initial January 2020 report (see Exhibit 1).

Higher Fiscal Deficit, Higher Issuance of U.S. Treasuries

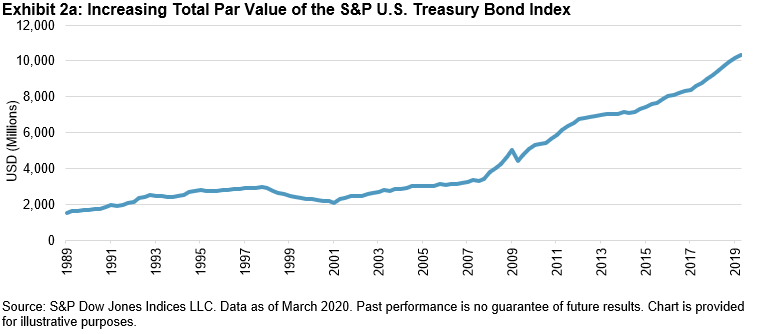
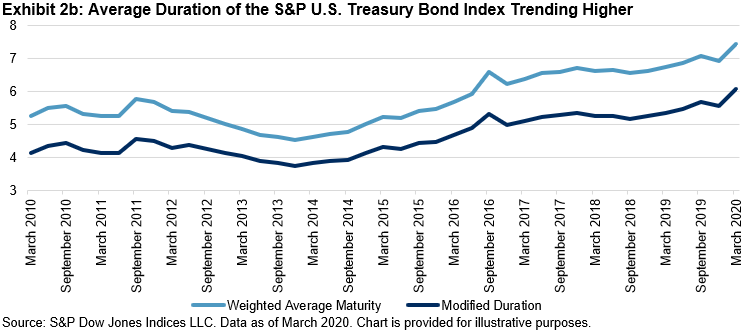
As stated in the latest U.S. Treasury quarterly refunding statement released on May 6, 2020, the U.S. Treasury has increased borrowing needs substantially as a result of the federal government’s response to the COVID-19 outbreak and expects to begin to shift financing from bills to longer-dated tenors over the coming quarters. In fact, the market size and average duration of outstanding U.S. Treasury securities had been steadily increasing even before the COVID-19 outbreak (see Exhibits 2 and 3). Now, both should continue to trend higher.

Markets’ Reaction to Increased Supply, So Far

Increased funding needs and the shift of some issuance to a longer tenor from U.S. Treasury bonds mean more duration supply from U.S. Treasury securities. How has the market weathered this increased supply and the expectation of more supply over the coming quarters?

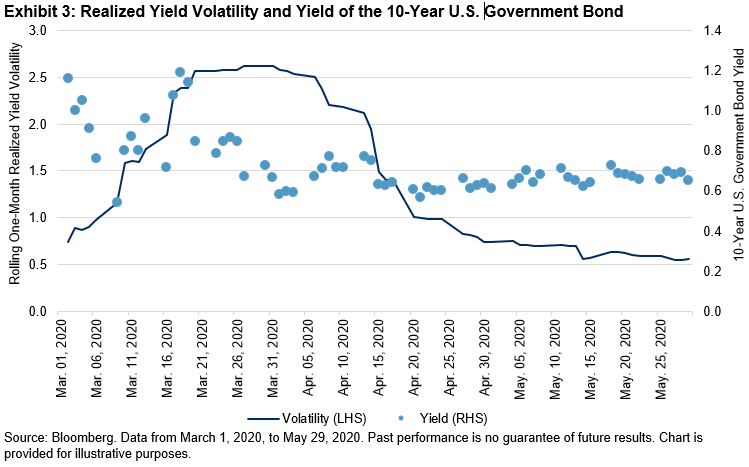
As the Federal Reserve revamped its large-scale asset purchase program at the same time, the bond market has absorbed the supply fairly well. From March 11, 2020, to May 27, 2020, securities held outright by the Federal Reserve increased from USD 3.9 trillion to USD 5.9 trillion. Exhibit 3 shows the 10-year U.S. government bond yield and rolling one-month realized yield volatility (annualized) since March 1, 2020. The 10-year U.S. Treasury yield jumped by 50 bps within a couple of days in mid-March 2020, but since then it has been trading in a tight range. Realized yield volatility has dropped back to the norm of the post-GFC low.

Looking Ahead

So far, the Fed’s bond purchasing program has been successful in capping yield and keeping yield volatility low. However, the substantial increase in the supply of U.S. Treasuries has opened up the upside risk of interest rates significantly, particularly given the Fed’s reluctant stance on negative rates. Looking forward, U.S. Treasury auctions and their results will continue to be closely monitored by market participants to gauge market appetite for duration supply.

The posts on this blog are opinions, not advice. Please read our Disclaimers.

S&P Pure Growth Indices – Attributes and Performance Drivers

Contributor Image
Wenli Bill Hao

Director, Factors and Dividends Indices, Product Management and Development

S&P Dow Jones Indices

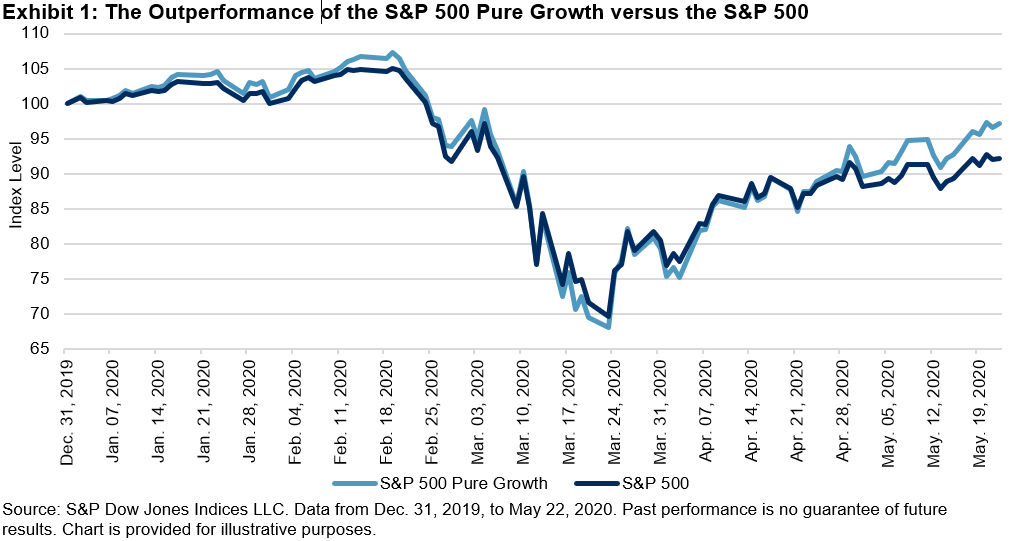
The S&P 500® has had a wild ride in 2020. The index hit an all-time high in February, then dropped 33.8% to the bottom in March due to the COVID-19 pandemic, and then rallied 32.6% by May 22. During this turbulent time, the S&P 500 Pure Growth, while declining along with markets, ultimately outperformed its benchmark by 4.92% (see Exhibit 1). The following analysis investigates attributes of this outperformance.

The S&P Pure Growth Index Series uses the following three components to define overall pure growth scores, and constituents are weighted based on their style scores:[i]

  • Three-year change in earnings per share (excluding extra items) over price per share;
  • Three-year sales per share growth rate; and
  • Momentum (12-month percentage price change).

Fundamental Risk Factor Exposure

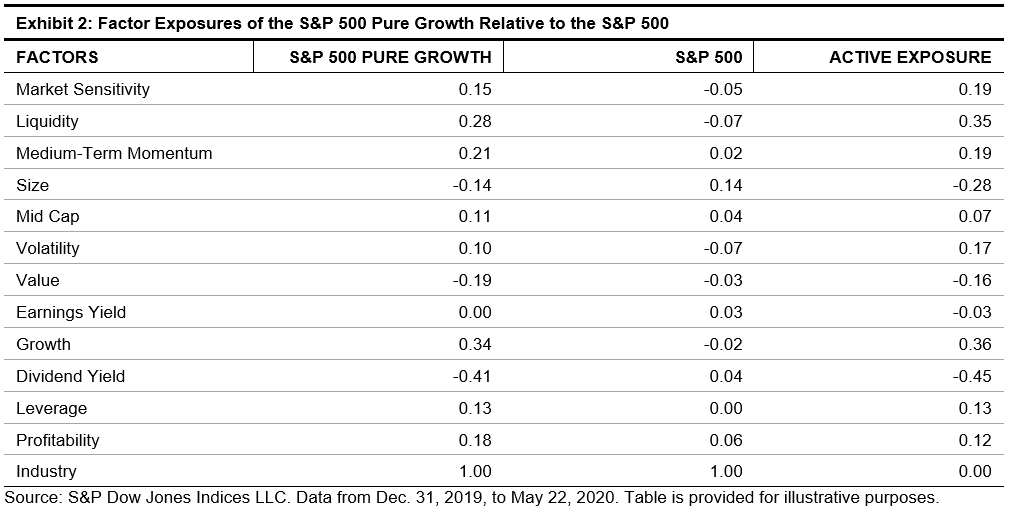
To better understand the characteristics of the S&P Pure Growth Index Series, we use a commercially available fundamental risk model to capture risk exposures. We measure active exposures of the S&P 500 Pure Growth relative to the S&P 500 (see Exhibit 2).

The S&P 500 Pure Growth had the highest positive tilt toward growth (0.36), followed by liquidity (0.35), medium-term momentum (0.19), and market sensitivity (0.19). Results were broadly in line with the index design . Moreover, the S&P 500 Pure Growth constituents tended to have higher return volatility, higher leverage, and better profitability.

On the other hand, the index was most underweight to the dividend yield factor (-0.45), followed by the size (-0.28) and value (-0.16) factors. This means that companies in the S&P 500 Pure Growth had lower dividend yields, tended to be smaller size, and had higher valuations than companies in the S&P 500 universe.

Sector Exposure and Performance Attribution

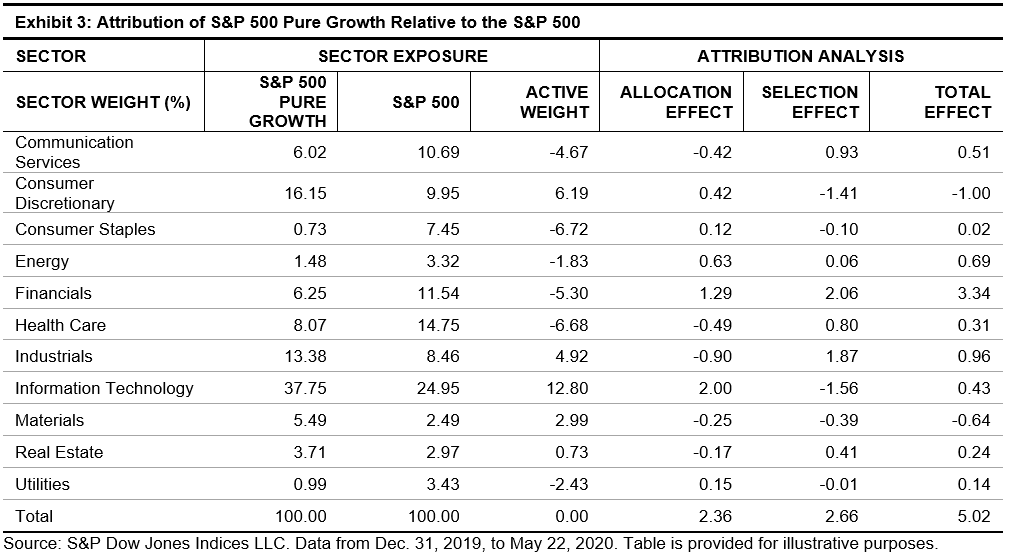
We next decompose excess returns of the S&P 500 Pure Growth into sector allocation and security selection of index constituents.

From Exhibit 3, we see the index was historically overweight in Information Technology (12.80%), Consumer Discretionary (6.19%), and Industrials (4.92%). In contrast, it was underweight in Consumer Staples (-6.72%), Health Care (-6.68%), Financials (-5.30%), and Communication Services (-4.67%) relative to the S&P 500.

The total performance effect was about 5%, with almost half of that coming from sector-allocation effects (2.36%). Information Technology and Financials had the highest sector effects of 2.00% and 1.29%, respectively. On the other hand, more than half of the outperformance came from selection effect (2.66%). Selection effect measures added value of security selection within a sector. The results showed that the methodology of the S&P 500 Pure Growth led to better-performing securities.

In conclusion, the S&P 500 Pure Growth outperformed its benchmark during this volatile period. This was mainly driven by positive exposure to growth and momentum and negative exposure to dividend and earning yields. Overall, sector allocation and security selection contributed to the outperformance.

[i] The detailed factor definition and index construction are laid out in the S&P 500 Pure Growth Methodology.

The posts on this blog are opinions, not advice. Please read our Disclaimers.