Get Indexology® Blog updates via email.

In This List

Golden Eye of the Storm

CARES Act: Why Quality Screening Is Now More Important Than Ever

The Mexican Peso: Liquid, Volatile, but Can We Hedge?

What’s New in the S&P Risk Parity Indices Methodology?

Two Birds, One Stone: How the S&P Paris-Aligned Climate Index Concept Meets the Proposed EU Climate Benchmark Regulation and the Recommendations of the TCFD

Golden Eye of the Storm

Contributor Image
Fiona Boal

Managing Director, Global Head of Equities

S&P Dow Jones Indices

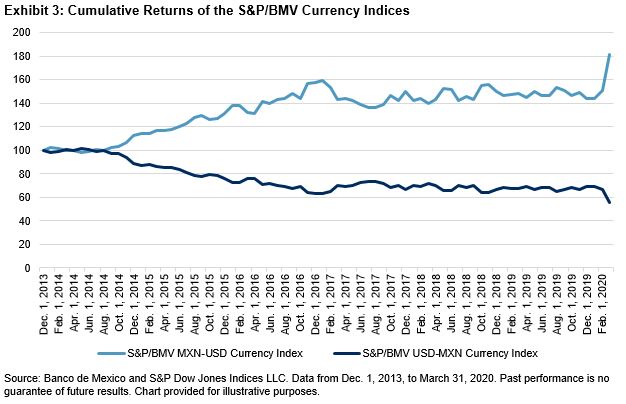
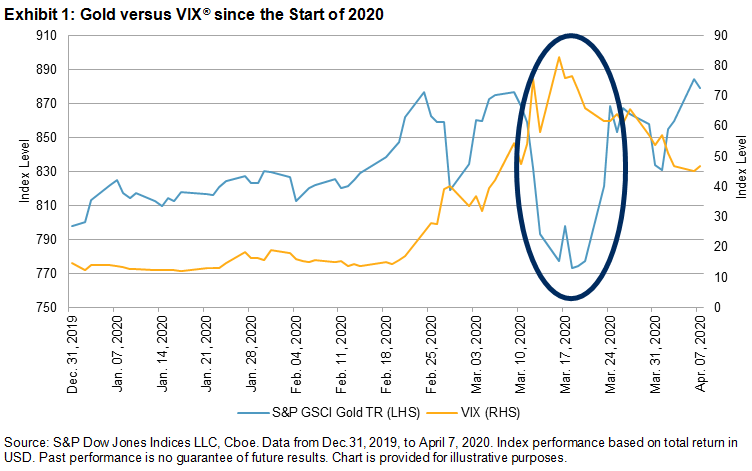
Much has been made of the relative performance of gold since the start of the global COVID-19 pandemic. The S&P GSCI Gold gained 10.2% YTD through April 7, 2020, highlighting its safe-haven status; however, it is worth reviewing this performance and considering what demand drivers may influence gold prices over the coming months.

The generally held belief is that gold is negatively correlated to equities during extended bear markets, but it is not unusual for gold, and other putative safe havens, to retreat in unison on big down days in the broader market. Gold’s high liquidity makes it an attractive component of a portfolio to sell in times of urgent need for cash, such as when meeting margin calls. This is what occurred in March 2020. The spike in volatility would also have forced investors to cut the overall size of risk-adjusted positions.

It is worth remembering that gold had already enjoyed a surge in investor interest prior to the current crisis, on the back of low to negative interest rates across the globe and a myriad of geopolitical flare-ups.

As for the demand side of the equation, there is plenty of uncertainty in the near term. Jewelry demand, which accounted for approximately 50% of all demand for gold in 2019, has undoubtedly fallen since the start of the year, but it is too early to say by how much. The World Gold Council estimated that Chinese consumer demand fell 30%-50% year-over-year in Q1 2020. Many also expect that jewelry demand in the West will not perform as strongly in the current economic climate.

Central bank buying is even more uncertain, with oil-rich nations negotiating the impact of a collapse in energy prices, and other global sovereigns looking to fund large stimulus packages to mitigate the impact of the current economic downturn.

Investor demand for gold is expected to remain strong, although from a portfolio construction and diversification standpoint, there will be a point at which large investors choose not to add to their gold holdings. The massive fiscal and monetary response by governments to manage, and hopefully lessen, the financial impact of the pandemic has triggered inflationary concerns among some investors. As a hedge against inflation, gold is still viewed by many market participants as the “currency of last resort.”

The supply-side implications should not be ignored. Disruptions to the flow of physical gold between London and New York has already caused some disturbances to the usually stable differential between London Spot and COMEX futures price and led to the launch of a new futures contract that allows for the delivery of a wider choice of gold bars. There has also been a notable disruption to mine supplies that will flow through to the market.

S&P Dow Jones Indices offers a variety of gold-related indices, including the S&P GSCI Gold, S&P WCI Gold, S&P Commodity Producers Gold Index, and S&P GSCI Gold Dynamic Roll 70/30 Futures/Equity Blend (USD).

The posts on this blog are opinions, not advice. Please read our Disclaimers.

CARES Act: Why Quality Screening Is Now More Important Than Ever

Contributor Image
Gaurav Sinha

Former Managing Director, Head of Americas, Global Research & Design

S&P Dow Jones Indices

The U.S. stimulus bill (the CARES Act) enacted on March 27, 2020, received significant attention for its support payments to individuals. However, it also has a significant impact for large corporations (see Exhibit 1).

This blog will take a closer look at two lending programs and their market impact within their respective segments.

CARES Act: Liquidity Where It’s Needed

The first program[i] is for loans and guarantees made through the U.S. Treasury or Federal Reserve for up to five years, at prevailing market rates prior to the outbreak. While this is welcome liquidity, it comes with a few restrictive covenants.

  • Companies must maintain 90% of their pre-virus employment and may not pay dividends or repurchase stock until 12 months after the loan terminates.
  • Only companies with “significant operations” and a “majority of employees” in the U.S. are eligible.

This means that companies that change their finance policies to access these loans may signal they have no other funding options available.

The U.S. Treasury will also provide financing[ii] to lenders to make direct loans at rates of 2% or less to businesses with 500-10,000 employees. Furthermore, for the first six months (or longer, at the Treasury’s discretion), no principal or interest shall be payable, though restrictions like those mentioned above remain in place here too. However, the distinction here is that the second program could significantly enhance the borrowing capacity of high-quality mid-sized companies, without needing to change their financing policies or signaling distress (given its accessibility through lenders or intermediaries).

This leads us to the following considerations.

  • First, below-market rates are welcome from a liquidity perspective.
  • Second, as we go down the market-cap scale, companies are more likely to have more than 50% of their employees based in the U.S., which would qualify them for this program.
  • Lastly, most of these qualifying companies with 500-10,000 employees are well represented across the core U.S. size indices.

Quality Matters in Times of Stress

The S&P Quality Indices consider ROE, accruals ratio (operating asset efficiency), and financial leverage to select higher-quality constituents. Our quality indices broadly outperformed during the recent sell-offs, while remaining competitive in the subsequent rebound and the previous 12-month run.

Similarly in small caps, the S&P SmallCap 600’s historical benefits over the Russell 2000 show that the index can provide small-cap exposure but with better quality through the profitability screens utilized in the S&P SmallCap 600 methodology.

Fixed Income

The bond market has long included its own proxy for quality, dividing assets into investment grade and high yield. The spread between the two has blown out recently, even with rates on Treasuries dropping. The Fed’s Primary and Secondary Market Corporate Credit Facilities (PMCCF and SMCCF), which are buying investment-grade bonds directly from issuers and in the market, has aided this flight to quality. The moves in yields and spread neatly illustrate the market’s updated expectations of enhanced survivability odds for investment-grade (quality) firms.

Perhaps, now it’s equities’ turn to focus their attention to where it’s needed most, i.e., quality!

[i] H.R. 116-748, Title IV, Sec 4003, (c)(2)

[ii] H.R. 116-748, Title IV, Sec 4003, (c)(3)(D)

The posts on this blog are opinions, not advice. Please read our Disclaimers.

The Mexican Peso: Liquid, Volatile, but Can We Hedge?

Contributor Image
Maria Sanchez

Director, Sustainability Index Product Management, U.S. Equity Indices

S&P Dow Jones Indices

With oil prices falling and the spread of the COVID-19 pandemic, volatility is back in action. In Latin America, Forex valuations are a key barometer. Local currency depreciation is one of the most common reactions to uncertainty (see Exhibit 1).

This blog highlights the recent volatility in the Mexican peso and possible ways to mitigate this risk.

Mexican Peso: Liquidity, but with Volatility

The Mexican peso was the most affected LatAm currency of March 2020. It had the worst monthly return since the “Tequila Crisis” or the error of December 1994 (see Exhibit 2). The March 24, 2020, closing price of MXN 25.1185 per USD 1 was the worst official closing level for the Mexican peso in March.

The Mexican peso is one of the most liquid and deep currencies among emerging markets, frequently used as a vehicle to hedge long positions, as a diversification strategy, and to take bearish tactical positions.

Conclusion: Investors Can Hedge

In the recent Mexican peso sell-off, our S&P/BMV USD-MXN Currency Index, which tracks U.S. dollar-Mexican peso spot rates, sold off; however, its inverse, the S&P/BMV MXN-USD Currency Index, as expected, gained. Having two options for indices measuring these currencies ensures that investors no longer have to just take one side of the trade and can use both sides to tactically hedge.

The S&P/BMV MXN-USD Currency Index returned 20.23% in March 2020 and 25.52% YTD.

For different asset classes, for tactical purposes, for long-term and diversification strategies, for hedging; whatever your needs may be, we likely have an index for that!

The posts on this blog are opinions, not advice. Please read our Disclaimers.

What’s New in the S&P Risk Parity Indices Methodology?

Contributor Image
Berlinda Liu

Former Director, Multi-Asset Indices

S&P Dow Jones Indices

Launched in August 2018, the S&P Risk Parity Indices were designed to be a transparent, passive alternative to active risk parity funds. The index series comprises several indices that are differentiated by volatility targets in an 8%-15% range.

This blog compares the original and new methodologies.

After consultations with stakeholders, S&P Dow Jones Indices has updated the methodology, effective April 6, 2020. Under the original methodology, realized volatilities of the indices generally fell below target. However, the new methodology is expected to ensure realized volatility is closer to the target. The S&P Risk Parity Indices rebalance monthly, and unlike the original methodology which uses historical weights, under the new approach the current rebalance weights are applied to get a more realistic estimate of forward volatility.

As Exhibit 1 shows, the original methodology’s realized volatility was short of its target volatility over the back-tested period. This isn’t surprising since the market has mostly experienced declining volatility over the past decade. Moreover, if market volatility had trended in the opposite direction, it is reasonable to expect that the index would have realized above its target.

The new methodology addresses this issue by holding constituent weights constant over the entire 15-year look-back period and using them to calculate volatilities and adjust leverage, thereby, delivering a realized volatility that is closer to the target over long- and mid-term horizons (Exhibit 1).

Relatively higher risk in the new index methodology was more than offset by higher returns, leading to a return/risk ratio of 0.76 compared to 0.66 with the original methodology (see Exhibits 2 and 3).

Lastly, to aid with replication, the index will now use security-specific roll schedules and use S&P 500® e-mini futures instead of a standard futures contract.

Since the methodology changes have a material impact on historical risk profiles, the entire time series has been restated.

With the above changes we believe the index will realize closer to its target volatility over the long-term.

The posts on this blog are opinions, not advice. Please read our Disclaimers.

Two Birds, One Stone: How the S&P Paris-Aligned Climate Index Concept Meets the Proposed EU Climate Benchmark Regulation and the Recommendations of the TCFD

Contributor Image
Mona Naqvi

Global Head of ESG Capital Markets Strategy

S&P Global Sustainable1

As the world continues to pump the gas on a one-way street toward catastrophic climate change, market actors are attempting to slow down the traffic by limiting global temperature rise to within 1.5°C since pre-industrial levels.[1] To date, climate-conscious investors have largely focused on reducing relative portfolio carbon exposure. However, divergent methodologies make fertile ground for greenwashing, while point-in-time analyses do not necessarily inform alignment with the low-carbon transition. To address this, the EU is proposing regulation to prevent climate index greenwashing.[2] Global efforts such as the G20’s Task Force for Climate-related Financial Disclosures (TCFD) also seek to enhance transparency with guidance for holistic climate disclosure. A new S&P Paris-Aligned Climate (PAC) Index Concept now offers a powerful tool to address the minimum EU standards for a Paris-aligned benchmark and the recommendations of the TCFD.

Minimum Standards for EU Climate Benchmarks

The EU’s action plan for financing sustainable growth proposes two new climate benchmarks: EU Climate-Transition Benchmarks (CTB) and EU Paris-Aligned Benchmarks (PAB), both using absolute measures to align with a 1.5°C trajectory rather than simply a relative carbon reduction. In 2019, an EU-appointed technical expert group (TEG) published a final report, which contains the proposed minimum standards. The final report will serve as the basis for the European Commission’s drafting of the delegated acts.

TCFD Recommendations

Two years prior, the TCFD released its recommendations for climate-related financial disclosures.[3] These include the financial impacts of climate-related risks and opportunities, comprising transition and physical risks (see Exhibit 2). The latter refers to physical hazards, for instance, more frequent and extreme weather events (storms, hurricanes, floods, etc.), weather pattern shifts, and sea-level rise. Physical risk thereby threatens companies facing asset-write downs, disruptions in supply chains, and costly insurance premiums,[4] whereas transition risk addresses the costs associated with the policy, legal, technological, market, and reputational risks from adapting to climate change. Conversely, the transition will also require USD 1 trillion of investment each year in gainful areas such as low-carbon energy and sustainable products.[5]

However, transition and physical risks are not a priori connected. The failure to transition to a low-carbon economy increases the likelihood and severity of physical risks, while the failure to mitigate physical risks suggests the market is not transitioning. Even under a 1.5°C scenario, physical risks will occur more frequently than at-present. A TCFD-aligned strategy must therefore account for both types of risk and the opportunities arising from climate change.

S&P Paris-Aligned Climate Index Concept

To meet the proposed EU regulation, S&P Dow Jones Indices has devised a new PAC Index Concept,[6] which additionally encompasses further objectives to align with a 1.5°C scenario and the TCFD.

  • Transition Risk: The concept weights companies based on their ability to transition in alignment with a 1.5°C scenario, using Trucost data with transition-pathway models endorsed by the Science-Based Targets Initiative. Further measures include 7% year-over-year decarbonization to avoid overshoot, overweighting companies with strong environmental policies arguably better positioned for the transition,[7] overweighting companies that disclose science-based targets,[8] and reducing fossil fuel reserve exposure to mitigate stranded asset risk.
  • Physical Risk: The concept achieves a 10% reduction in physical risk exposure using state-of-the-art Trucost data, accounting for geolocation-specific risk and sensitivity of company assets to climate hazards.[9] Dynamic capping of individual company weights based on physical risk exposure also reduces tail risk.
  • Climate Opportunities: By improving the green-to-brown ratio relative to the underlying index, the S&P PAC Index Concept exhibits greater exposure to green power generation sectors expected to benefit from the transition.

These objectives are simultaneously incorporated while minimizing deviations from the underlying index, resulting in a broad, diversified index with similar performance to that of the underlying benchmark. The S&P PAC Index Concept thus offers a formidable new tool for meeting the proposed EU regulation—as well as a resilient and holistic approach to addressing climate risks and opportunities, as per the TCFD.

[1]   The aim of the Paris Agreement is to strengthen the global response to the threat of climate change by keeping global temperature rise well below 2°C above pre-industrial levels and to pursue efforts to limit the temperature increase even further to 1.5°C—see here. According to the Intergovernmental Panel on Climate Change (IPCC), climate adaptation will be less difficult under a 1.5°C scenario, as “our world will suffer less negative impacts on intensity and frequency of extreme events, on resources, ecosystems, biodiversity, food security, cities, tourism, and carbon removal”—see here.

[2]   In May 2018, the EU announced proposals to create two new climate benchmarks as part of its action plan for financing sustainable growth. In December 2018, the law creating these new benchmarks was officially enacted via amendment EU 2019/2089. An EU-appointed TEG later published its final report on climate benchmarks and benchmark ESG disclosure in September 2019, containing proposed minimum technical standards for these benchmarks that are still at the proposal stage. The report provides proposals to the European Commission that will be used to prepare the delegated acts.

[3]   See Final Report: Recommendations of the TCFD (June 2017), available here.

[4]   For example, in an attempt to curb global emissions, carbon taxes and emission trading schemes are increasing operating costs for carbon-intensive companies, while the substitution of existing products or technologies to lower carbon alternatives creates technology risk amid possible early retirement of assets. Further, shifts in consumer preferences for low-carbon substitutes and reputational damage to companies that are slow to adapt can erode brand value and ultimately decrease company revenues.

[5]   TCFD Final Report (June 2017), Executive Summary Page ii, available here.

[6]   For full details of the proposed S&P PAC Index Concept, see here.

[7] The S&P PAC Index Concept ensures improved environmental policy credentials, as measured by S&P DJI Environmental Scores. The scores provide insights into financially material aspects of a company’s climate strategy, environmental policy and management systems, electricity generation, environmental business risks and opportunities, low-carbon strategy, recycling strategy, co-processing, and more. To learn more about S&P DJI Environmental and ESG Scores, visit https://spdji.com/topic/esg-scores.

[8]   Subject to the conditions specified by the TEG to prevent greenwashing and encourage disclosure.

[9]   Trucost physical climate risk data covers hazards related to wildfires, cold waves, heat waves, water stress, sea-level risk, floods, and hurricanes. To learn more about Trucost physical climate risk data, see here.

The posts on this blog are opinions, not advice. Please read our Disclaimers.