The S&P 500 closed April 23, 2019, at a new record high. The index’s closing value of 2,933.68 is the highest since the 2,930.75 posted on Sept. 20, 2018. From that previous high, the benchmark declined 19.86% to 2,351.10 by Dec. 24, 2018, narrowly avoiding bear market territory. December 2018 was the second-worst December in the history of the S&P 500, only better than December 1931.
In the first seven trading days of 2019, the S&P 500 marked its 12th best start on record since 1928 and its best since 2003. The index rebounded, posting three consecutive positive months to start 2019, pausing only briefly around 2,800 resistance levels. April is currently on pace to post the fourth consecutive month of gains. As of the close on April 23, 2019, the S&P 500 was just 2.26% away from reaching 3,000.
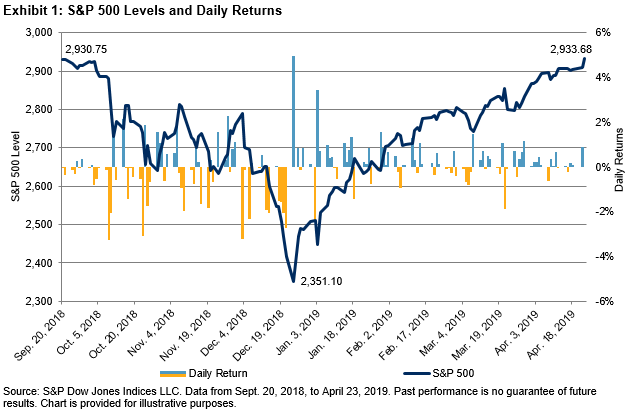
Market corrections are often short lived and the recovery swift—this most recent occurrence was no exception. Since the start of 1989, there have been 10 instances when the S&P 500 declined over 10% from a record high, which averages to about once every three years, and the average number of trading days it took for the S&P 500 to reach a new record high again was 428. Excluding the dot-com crash (March 2000-October 2002; 1,803 days to new high) and housing crisis (October 2007-March 2009; 1,376 days to new high), the average of the remaining eight instances was 138 trading days, or roughly six months. This most recent period, September 2018 to April 2019, had 146 trading days between new record highs.

Earnings season is underway and has helped push the S&P 500 to its new record close. Although far from complete, and with many noteworthy companies yet to report, earnings reported thus far have been solid overall, buoyed by modest expectations. Among other factors, the correction from the previous high in September was triggered by fears of slowing economic growth in China and Europe, the escalating U.S.-China trade dispute, expectations that the Federal Reserve would continue raising interest rates, and a softening housing market. These issues remain mostly unresolved, but sentiment has shifted with progress being made in U.S.-China trade negotiations and the Fed becoming more dovish to the point that it paused rate increases and unwinding its balance sheet for the foreseeable future.
The Dow Jones Industrial Average® is rebounding, but has not yet fully recovered from the correction. Closing at 26,656.39 on April 23, 2019, The Dow® sits just 0.65% below its all-time high close of 26,828.39 (Oct. 3, 2018). The mid- and small-cap core indices are also approaching—but have not yet surpassed—their pre-correction highs, and they could be considered to have lagged large caps in the rebound. The S&P MidCap 400® and S&P SmallCap 600® would need to rise by another 4.03% and 13.04%, respectively, in order to achieve new highs.


 Source: S&P Dow Jones Indices LLC. Data as of Apr. 19, 2019. Data has been based at 100. Past performance is no guarantee of future results. Chart is provided for illustrative purposes.
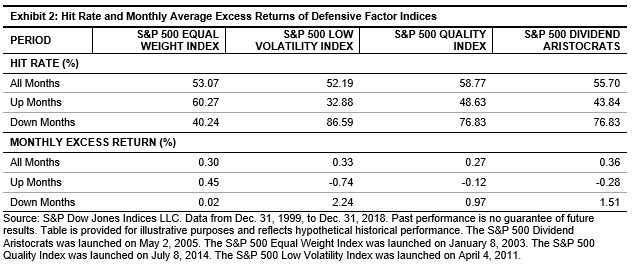
 Source: S&P Dow Jones Indices LLC. Data as of Mar. 29, 2019. Past performance is no guarantee of future results. Table is provided for illustrative purposes.