Global equity markets experienced a challenging February. A U.S.-led selloff triggered a spike in volatility; the Cboe Volatility Index (VIX) recorded its largest ever daily increase on February 5 to reach its highest level since August 2015.
But is higher volatility here to stay?
Towards the end of last year, we published a paper – and a practitioner’s guide – offering a way to convert a VIX level into an estimate for future S&P 500® volatility. Using the steps outlined in these papers (and a previous blog post), we calculate that given the recent market environment, we might expect the VIX to be around 24.061. Instead, it closed last night at around two-thirds of that: ending the day at 16.54.
The significant difference between the actual and expected level of VIX suggests that realized volatility may decline at a faster-than-usual rate from its present highs. In numerical terms, the details of our paper – applied to the present circumstances – tell us that we might anticipate S&P 500 volatility of around 11% (annualized) over the next 30 days2. Of course, this is a far from perfect prediction; the actual realized volatility of the S&P 500 is extremely unlikely to be exactly as predicted.
Nonetheless, once suitably interpreted, the information encoded in VIX has a moderately impressive record in predicting future changes in volatility. Despite the recent uptick in volatility, VIX is telling us that market participants are expecting a return to calmer waters.
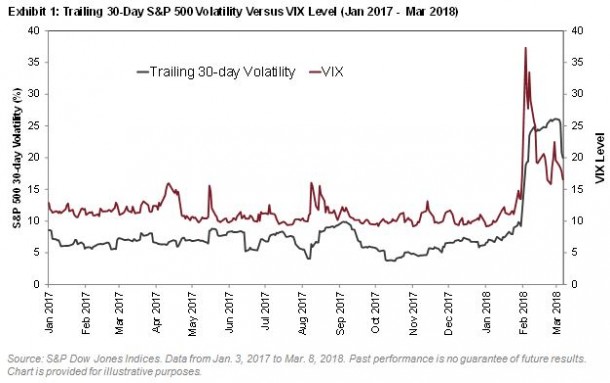
(1,2) Realized volatility in the S&P 500 over the last 30 days was 19.97% annualized, giving an expected “mean reverted” (MR) volatility of 18.52%. Adding the expected premium of 5.54 for this level of MR volatility provides an Expected VIX of 24.06. Subtracting the 7.52% difference between VIX and Expected VIX from the MR volatility of 18.52% provides the expected volatility of 11.00%. See “Reading VIX: Does VIX Predict Future Volatility?” for more details of both calculations.
The posts on this blog are opinions, not advice. Please read our Disclaimers.