In continuation to our previous blog titled “Factor Investing 101,” this blog investigates the performance of single factor indices in the Indian equity market. Over the period from October 2005 to June 2017, portfolios for all risk factors we examined—low volatility, momentum, value, quality, dividend, and size (small cap)—outperformed the S&P BSE LargeMidCap (see Appendix A for methodology of factor portfolios). However, only low volatility, quality, and momentum delivered better risk-adjusted return (return per unit of risk) than the S&P BSE LargeMidCap. Among the six factors, low volatility and quality recorded lower return volatility than the benchmark and had the highest risk-adjusted return, while value, dividend, and size displayed much more volatile return than the benchmark (see Exhibit 1).

Macroeconomic and market events affected each factor portfolio in different ways. Factor returns tended to exhibit cyclicality with periods of outperformance and underperformance in different phases of the cycles. In our report, we also examined how various risk factors performed in the Indian equity market across different macroeconomic regimes between October 2005 and June 2017.
Based on our factor performance analysis across business cycles,[1] we observed that value, dividend, and size exhibited strong pro-cyclical characteristics and tended to outperform the benchmark when business activities expanded. In contrast, low volatility, quality, and momentum outperformed the benchmark in both cycle phases but with a higher tendency to outperform the benchmark during business cycle contraction (see Exhibit 2). 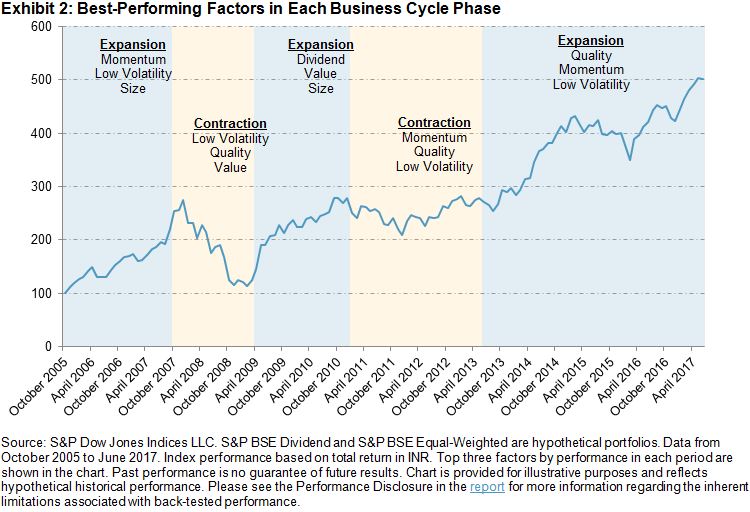
Apart from business cycles, factors also displayed different cyclical behavior across market cycles[2] that we divided into bearish, recovery, and bullish phases based on historical price trends of the S&P BSE SENSEX. Quality and low volatility tended to perform the best in bearish markets. Conversely, value, dividend, and size gained the highest excess returns when the market recovered from equity market troughs. In bullish markets, momentum had the strongest performance among all factors see Exhibit 3).

In addition, we also studied factor performance over investor sentiment regimes, which changed more frequently than market and business cycle phases. We used the rolling 22-day realized return volatility of the S&P BSE SENSEX Price Return as a proxy to measure investor sentiment in the Indian equity market. We divided the examined period into three sentiment regimes: bullish, neutral, and bearish. Bearish investor sentiment is signaled by high levels of realized volatility (values in the bottom decile), whereas bullish investor sentiment is represented by low realized volatility values (values in the top decile), and neutral investor sentiment makes up the periods when the realized volatility values lie between the top and bottom deciles. When market participants were bullish, results showed that value delivered the most excess return, while low volatility had the worst performance. In contrast, momentum and size underperformed, and high-quality stocks were favored by market participants when they were bearish. 
| Appendix A: Overview of the S&P BSE Single-Factor Indices and Hypothetical Portfolios | ||
| FACTOR | INDEX | DESCRIPTION |
| Low Volatility | S&P BSE Low Volatility Index | The 30 least volatile companies from the S&P BSE LargeMidCap, weighted by inverse proportion to their volatility and subject to a stock capping of 5%. Volatility is defined as the standard deviation of a security’s daily price return over the one-year period. |
| Momentum | S&P BSE Momentum Index | The 30 companies from the S&P BSE LargeMidCap with the highest momentum scores. Constituents are weighted by the product of momentum score and float-adjusted market capitalization (FMC) and subject to stock capping of a minimum of 5% or three times the FMC weight in the eligible index universe. Momentum score is computed as 12-month price change, excluding the most recent month, divided by standard deviation of price return for the same period. |
| Value | S&P BSE Enhanced Value Index | The 30 companies from the S&P BSE LargeMidCap with the highest value scores, weighted by the product of value score and FMC and subject to sector capping of 30% and stock capping of a minimum of 5% or 20 times the FMC weight in the eligible index universe. Value score is calculated based on book-to-price, earnings-to-price, and sales-to-price ratios. |
| Quality | S&P BSE Quality Index | The 30 companies from the S&P BSE LargeMidCap with the highest quality scores, weighted by the product of quality score and FMC and subject to sector capping of 30% and stock capping of a minimum of 5% or 20 times the FMC weight in the eligible index universe. Quality score is calculated based on return on equity, accruals ratio, and financial leverage ratio. |
| Dividend[3] | S&P BSE Dividend Portfolio | The 30 companies from S&P BSE LargeMidCap with the highest dividend yield, weighted in relative proportions to their dividend yields subject to sector capping of 30% and stock capping of 5%. |
| Size | S&P BSE Equal-Weighted Portfolio | All constituents from S&P BSE LargeMidCap weighted equally constitute the portfolio. |
Source: S&P Dow Jones Indices LLC. The S&P BSE Dividend Portfolio and S&P BSE Equal-Weighted Portfolio are hypothetical portfolios. Data as of October 2017. Table is provided for illustrative purposes.
Please refer to Factor Performance Across Different Macroeconomic Regimes in India for more information on this research paper.
[1] A business cycle is defined by the monthly movement of the Organisation for Economic Co-operation and Development (OECD) Composite Leading Indicator (CLI) for India. A rising CLI signals business cycle expansion and a falling CLI signals business cycle contraction (see Appendix A in report for the OECD Composite Indicator business cycles).
[2] A bearish phase is defined as a period during which the S&P BSE SENSEX goes from peak to trough. A recovery phase is defined as the 12-month period after the S&P BSE SENSEX trough. A bullish phase is defined as a period from the end of the recovery phase to the next S&P BSE SENSEX peak (see Appendix B in report for Illustrative Market Cycles).
[3] The eligibility criteria for the dividend portfolio require that each eligible stock maintains a ratio of dividend-per-share to par value-per-share above 10% for two consecutive years.
The posts on this blog are opinions, not advice. Please read our Disclaimers.