Get Indexology® Blog updates via email.

In This List

The Growth of Dividend Investing and Driving Forces

What the Earthquake Left Us

Credit Risk Measure in the S&P U.S. High Yield Low Volatility Corporate Bond Index

Low Volatility, VIX and Behavioral Finance

Diwali Gold Buying May Be The Safest Since 1996

The Growth of Dividend Investing and Driving Forces

Contributor Image
Liyu Zeng

Director, Global Research & Design

S&P Dow Jones Indices

Dividend investing is an ever popular topic across different markets.  Market participants have been using ETFs to implement various dividend strategies for more than a decade.  The first dividend ETF, the iShares Select Dividend, was launched in 2003.  Nevertheless, dividend ETPs have experienced tremendous growth in assets since year-end 2009.  As of June 30, 2017, the total assets of purely dividend screened or weighted ETPs reached USD 178.6 billion, with a compound annual growth rate of 35.5% since year-end 2009 (see Exhibit 1).

Despite rising AUM in the low/minimum volatility and multi-factor ETPs in the past two years, dividend ETPs have remained the leading category of strategic-beta ETPs by assets across many regions and countries.[1]  In the first three quarters of 2017, dividend ETPs dominated the inflows among various types of smart beta ETPs.[2]

The most cited growth driver for dividend investing is the global low-yield investment environment seen in recent years.  As shown in Exhibit 3, the growth of dividend ETPs’ assets since year-end 2009 coincided with a period of low and declining 10-year government bond yields in the U.S., eurozone, and Japan.

Another underlying and probably longer-term driver for the growth of dividend investing is the demographic change in high income regions, such as the U.S., European Union, and Japan (see Exhibit 4).  As more market participants move gradually from the consolidation to the decumulation stage of their investment lifecycles, dividend strategies can become an attractive investment option for providing stable cash flows.

Among various types of income ETPs listed in the U.S., high-dividend equity ETPs recorded the highest five-year absolute and risk-adjusted return as of Aug. 31, 2017, although they had lower yield than a few other income asset classes.  Compared to other equity income products, such as REITs and MLP ETPs, high-dividend equity ETPs tend to have less sector concentration risk and lower price volatility.  Despite the rate hikes since December 2015, U.S. interest rates remain low and high-yield ETPs, which offer yield premium, remain attractive to income-seeking market participants.

[1]   A Global Guide to Strategic-Beta Exchange-Traded Products (September 2016 and September 2017).  Morningstar Manager Research.

[2] Blackrock Global ETP Landscape September 2017 Report.

The posts on this blog are opinions, not advice. Please read our Disclaimers.

What the Earthquake Left Us

Contributor Image
Jaime Merino

Former Director, Asset Owners Channel

S&P Dow Jones Indices

It is interesting and amazing to see how people react to natural disasters.  Whether it be a hurricane, flood, tsunami, earthquake, and no matter where the disaster is located, the whole world takes notice and helps with anything they can.  This was certainly the case for Mexico after the 7.1 magnitude earthquake that shook the capital on Sept. 19, 2017 (12 days after an 8.2 earthquake in the country, and exactly 32 years later after the most significant and deadliest earthquake to hit Mexico City), where thousands of Mexicans took to the streets to help in some way.  Troops from around the world (Chile, China, Colombia, Costa Rica, Ecuador, El Salvador, Spain, Guatemala, Honduras, Israel, Japan, Panama, and the U.S., among others) collaborated in search and rescue efforts in the aftermath.  We, and I believe all Mexicans, are very grateful to the people that helped and are still helping—thanks so much to all of you.

But the most amazing part is that the generosity was not only that of the people, but companies from sectors like telecommunciations and transportation also helped for eight days by not charging fees for internet, telephone services, public transportation, and many toll roads, and this contributed to a 0.31% drop in year-over-year inflation for September 2017 after 14 consecutive months of increases.  Exhibit 1 shows the history of annual CPI over the past 10 years.

Exhibit 2 shows the performance of Mexican inflation-linked bond indices in different periods, and we can see how in the one-month window, the short-term end of the curve saw gains, while losses were observed in the middle and long term.

If you were wondering how inflation behaved after the 1985 earthquake, Exhibit 3 shows inflation from 1980-1990, where we can see that inflation rose for 15 consecutive months after the earthquake—but it’s difficult to make a conclusion based on that data, since during that time Mexico had severe hyperinflation problems.

Now that we have talked about natural disasters, there is an imminent “natural disaster” with the NAFTA negotiations.  Over the past 22 days (from the Sept.19, 2017, earthquake through Oct. 11, 2017, as the fourth round of negotiations begins) the Mexican peso depreciated 5.37% (almost MXN 1) against the U.S. dollar.  Exhibit 4 shows the performance of the UMS index series, and we can see how over the past month, the currency’s depreciation has helped in the performance of these indices, and in some cases it has evened out YTD losses.

The posts on this blog are opinions, not advice. Please read our Disclaimers.

Credit Risk Measure in the S&P U.S. High Yield Low Volatility Corporate Bond Index

Contributor Image
Hong Xie

Former Senior Director, Global Research & Design

S&P Dow Jones Indices

Common risk measures in equities include the volatility of price return and beta measuring price sensitivity to market.  However, in fixed income, volatility measures for bonds are not as straightforward as equities.  First, it can be challenging to obtain reliable daily prices for bonds that do not trade every day.  Second, using the simple measure of price return volatility to construct a low volatility bond portfolio could introduce unintended bias.  For example, given that the price return of a bond is determined by the bond’s duration and yield change, a bond portfolio constructed using the volatility measure of standard deviation of price return could be biased toward bonds with short duration.

In the construction of the S&P U.S. High Yield Low Volatility Corporate Bond Index, an individual bond’s credit risk in a portfolio context is measured by its marginal contribution to risk (MCR), calculated as the product of its spread duration and the difference between the bond’s option adjusted spread (OAS) and the spread-duration-adjusted portfolio average OAS (see Equation 1).  This definition allows for measuring the incremental contribution of each bond to the portfolio credit risk within the framework of duration times spread (DTS).

DTS is an industry-accepted measure of credit risk for corporate bonds, and is calculated by multiplying spread duration and OAS (see Equation 2).  Similar to spread duration capturing bond price sensitivity to spread change, DTS measures bond price sensitivity to the percentage change of OAS (Equation 3).  Ben Dor, Dynkin, Hyman, Houweling, Leeuwen, and Penninga (2007) demonstrate that spread changes are proportional to the level of spreads, i.e., the volatility of percentage spread change is much more stable than absolute spread volatility, and therefore they propose that the better measure of exposure to credit risk is not the contribution to spread duration, but the contribution to DTS.

MCR borrows the concept of DTS by multiplying spread duration by the difference between bond OAS and portfolio average OAS, instead of OAS directly.  By doing so, bonds with low MCR will include those with long spread duration and below average OAS, as well as those with short spread duration and above average OAS.  By selecting bonds with low MCR, the low volatility index keeps more credit exposure (long spread duration) for high-quality bonds (low OAS) and less credit exposure (short spread duration) for low-quality bonds (high OAS).  Overall, this reduces the spread duration mismatch between the low volatility index and the underlying universe.  In the case of stressed bonds with extremely short spread duration, ranking MCR instead of DTS makes it less likely to rank stressed bonds in the lower end, and therefore reduces the likelihood of classifying stressed bonds as low volatility.

The posts on this blog are opinions, not advice. Please read our Disclaimers.

Low Volatility, VIX and Behavioral Finance

Contributor Image
Tim Edwards

Managing Director, Index Investment Strategy

S&P Dow Jones Indices

As this week’s award of the Nobel Prize in Economics to Richard Thaler confirmed, the existence of behavioral biases in finance is no longer a controversial theory.   People often prefer a small chance of a large gain to a near-certain chance of a small gain, even if the expected return from the latter is higher.  Anyone who doubts this should reflect on the ubiquitous profitability of lotteries; governments have found them a reliable source of revenue, despite the fact that the expected value of buying a lottery ticket is negative.

Analogously, we sometimes attribute the so-called Low Volatility Anomaly to behavioral causes; risk-seeking investors prefer to buy exciting stocks for their perceived upside potential, while investors in lower-volatility stocks reap the reward of risk-seekers’ undue enthusiasm; figuratively, they are selling lottery tickets.

Low Volatility equity strategies have generated their long-term outperformance in part  by mitigating losses in down markets; the price of this loss mitigation is that low vol strategies underperformed in rising markets. This is illustrated in Exhibit 1 for the S&P 500 Low Volatility Index:

Participating in only three quarters of gains can be frustrating for some investors; one way to limit the risk of lagging in bull markets is to combine Low Volatility with different equity factors.    Another approach is to look beyond equities for complementary exposures.  Low volatility investors are not the market’s only behavioral economists.  Volatility-linked investments (such as VIX futures) can also display lottery-like characteristics, with the potential for large returns in a crisis if VIX spikes, and persistent losses otherwise.   Thus, selling VIX futures is another way in which some investors can profit from the lottery-seeking behavior of others.

The S&P 500 VIX Short Term Futures Inverse Daily Index measures the performance of continuously holding and rolling a short position in near-dated VIX futures.  Although it has an intimidatingly long name (we shall use “Short VIX” to refer to it), it has inviting characteristics as a potential diversifier for Low Volatility.  While the same behavioral dynamics may underlie the historically impressive returns both of buying lower-volatility stocks and selling VIX futures, the market dynamics affecting their performance are very different.  Exhibit 2 shows that in months when Low Volatility underperformed the S&P 500, on average Short VIX outperformed.   In months when Low Volatility outperformed, on average Short VIX underperformed.

The Short VIX strategy has a much higher level of absolute risk: an equal combination of Low Vol and Short VIX will be dominated by the latter.  (And the higher volatility of the Short VIX strategy also means that rebalancing frequently might be necessary to keep weights in proportion.)  With those characteristics in mind, Exhibit 3 shows the performance of a hypothetical portfolio (“MIX”), comprising a small position in Short VIX (7.5% weighting), with the remainder in Low Volatility.  The total returns of the S&P 500, and the S&P 500 Low Volatility Index, are shown for purposes of comparison.

While the long-term outperformance of the MIX portfolio is unsurprising (both Short VIX and Low Volatility have outperformed), the key feature of MIX is its upside/downside capture ratio, shown in Exhibit 4:

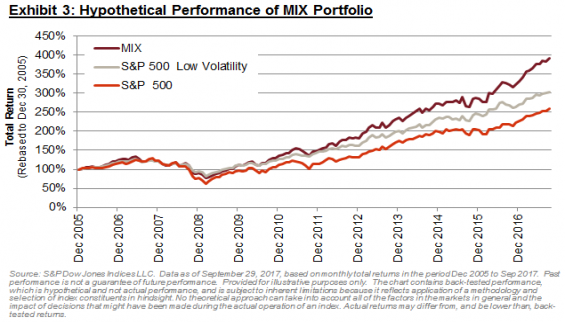
On a hypothetical basis, the MIX portfolio achieved roughly 100% upside capture (i.e. it did not lag in bull markets), while retaining a considerable degree of protection (77% downside capture).  The MIX portfolio also demonstrated favourable performance statistics over longer periods.  Over all possible rolling 12-month periods during our study, Low Volatility outperformed around 59% of the time; this increases to 72% for the MIX portfolio (Exhibit 5).

The last year reminds us that it can be difficult to remain invested in lower volatility stocks during strong bull markets. The potential addition of a small, rebalanced position in a strategy such as Short VIX could act to diminish the risk of underperformance in rising markets, and provides a potentially coherent way to capture two complementary sources of behavioral outperformance.

The posts on this blog are opinions, not advice. Please read our Disclaimers.

Diwali Gold Buying May Be The Safest Since 1996

Contributor Image
Jodie Gunzberg

Former Managing Director, Head of U.S. Equities

S&P Dow Jones Indices

In light of the gold buying tradition for the upcoming Diwali festival in India, many might be wondering how valuable their gifts may be based on the price of gold.  Several factors influence the price of gold that make timing gold as an investment difficult; however, now there might be upside potential for gold, especially since its volatility is so low.

Currently, the 90-day annualized volatility (ending on Oct. 10, 2017) of the S&P GSCI Gold is 12.3%.  It has been hovering around this level since July and is at its lowest since August 2005.  Though 12 years is a long time, when gold’s current volatility is compared with its volatility during past Diwali celebrations, one needs to look all the way back to Diwali 1996 to find lower volatility.  In all of gold history since 1978, the 2017 Diwali period exhibits the sixth lowest volatility on record and is only higher than levels observed in 1991, 1992, 1994, 1995 and 1996, denoted by the vertical lines in the chart below.

Source: S&P Dow Jones Indices

Like other factors in isolation, the low gold volatility does not have strong predictive power over future gold price moves.  However, when gold had big losses of more than 30% in one year, there was always greater than 30% volatility.

Source: S&P Dow Jones Indices

On the other hand low gold volatility has been present when big positive returns of more than 40% in one year have happened.  Interestingly, big returns have also happened when the gold volatility was very high.  Though, when gold volatility was moderately high in the 25% – 40% range, it never returned more than 40% except in 1979 when gold returned 263.3% from Jan. 19, 1979 – Jan. 21, 1980 with 90-day annualized volatility of 32.6% (the data point was removed for scale.)

Source: S&P Dow Jones Indices

Based on the history, it seems there may be more upside potential than downside risk for gold with its current low level of volatility.  What may be more important though is how solidly gold has provided diversification from equities.   Given the historically strong bull run the stock market is having, if the market has corrected as it has in the past, some gold as protection may be useful.

Other factors to watch for moves on gold are the U.S. dollar, inflation, GDP growth and interest rates:

  • Gold rises on average about 3% for every 1% the U.S. dollar drops, but gold still holds up, gaining about 20 basis points for every 1% rise in the dollar (using year-over-year monthly data from Dec. 1986 – Jun. 2017.)
  • Gold is also sensitive to inflation, moving on average about 5.9% for every 1% U.S. CPI moves and about 4.5% for every 1% Chinese CPI moves (using year-over-year monthly data from Aug. 2007 – Aug. 2017.)
  • Gold gains significantly more with decelerating economic growth in the U.S. and U.K. (in-line with the diversification,) but gains more with accelerating growth in emerging economies like China (using annual year-over-year data from 1978 – 2016:)
    • In the U.S., gold rises on average 7.7% when GDP growth falls 1%, but gold loses on average 1.4% for every 1% of rising GDP growth.
    • In the U.K., gold rises on average 6.3% when GDP growth falls 1%, and gold also rises on average 1.3% for every 1% of rising GDP growth.
    • In China, gold rises on average 2.1% when GDP growth falls 1%, but gold rises more on average, gaining 3.2% for every 1% of rising GDP growth.
  • Gold rises on average 27.7% during rising interest rate periods (using monthly data from Jan. 1978 – Feb. 2017.)

The bottom line is that there may be more upside potential for gold given its low volatility, in conjunction with several other factors in question like continued dollar strength, economic growth, rising inflation and interest rates.

The posts on this blog are opinions, not advice. Please read our Disclaimers.