In anticipation of the Federal Reserve’s policy meeting starting Wednesday that may raise the federal funds target rate, here’s what you need to know about how the decision impacts commodities.
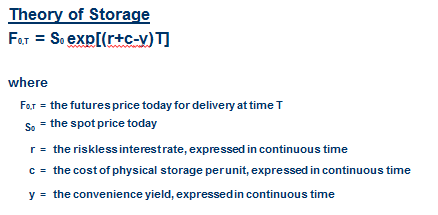
Historically rising interest rates are positive for commodities for two main reasons. One is the return on collateral increases, pushing up the total return. The other reason is that producers may be disincentivized to produce and store as carrying costs increase. This is fundamentally based on the futures relationship to the spot market. In order for the market clear, the convenience yield must equal the opportunity cost, which is expressed in the formal relationship between buying the futures price today for delivery at time T and buying the commodity at the spot price today and storing it until time T. The futures prices can be expressed in terms of the spot price, interest rate, cost of storage and convenience yield, through the central equation of the “theory of storage”.
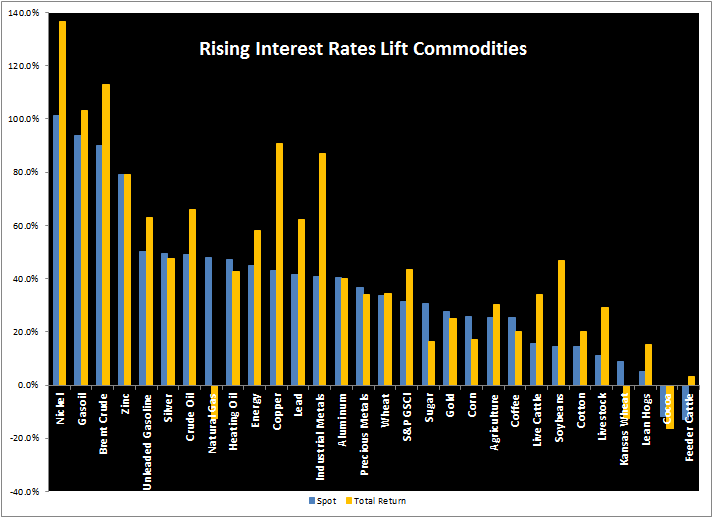
This is not just theoretical but is supported by the data. On average in rising rate periods, the S&P GSCI Total Return index has gained 43.5% more than the spot index that has gained on average 31.3%, showing that rising rates can drive carrying costs higher, making it less beneficial to hold inventory.
The impact benefits some commodities more than others, and the ones that gain most tend to be the more economically sensitive energy and industrial metals. For example, rising rates help oil more than gold. In rising rate periods, (WTI) Crude oil gains on average 49.0% and Brent crude gains nearly double that up 90.0%. What’s even more interesting is that the term structures become backwardated, again as producers are disincentivized to produce and store amid higher interest rates since it is more expensive. The impact can be observed in the added return from the positive roll yield. Brent on average adds an additional 22.9% and (WTI) Crude oil gains an additional 16.8%. If rates rise, it can possibly be the catalyst to get U.S. inventories down, which is the key factor in the oil rebound.
Gold on the other hand only gains on average 27.7% in rising rate periods but remains in contango, losing 2.8% since it is so supplied, relatively cheap and easy to store.
Another indicator the market is watching is the monthly consumer price index (CPI,) scheduled to be published early Wednesday by the Bureau of Labor Statistics. Oil is the most sensitive commodity to inflation since energy is the most volatile component of CPI. Historically going back to 1971, the inflation beta of the S&P GSCI is 3.4 which means for a 1% increase in inflation, it results in a 3.4% increase in return of the S&P GSCI during the period from 1971–2017. However, when the time period is shortened to start in 1987, the inflation beta jumps substantially to 13.8. This is since 1987 is the year oil was added into the index. The impact is also observed by comparing the inflation beta between the S&P GSCI and Dow Jones Commodity Index (DJCI.) The inflation beta since 2000, which is when data for DJCI is available, the inflation beta of DJCI is 12.3 versus 16.5 for S&P GSCI. This is since energy is only 1/3 of the equally weighted DJCI versus about 65% in energy in the world production weighted S&P GSCI.
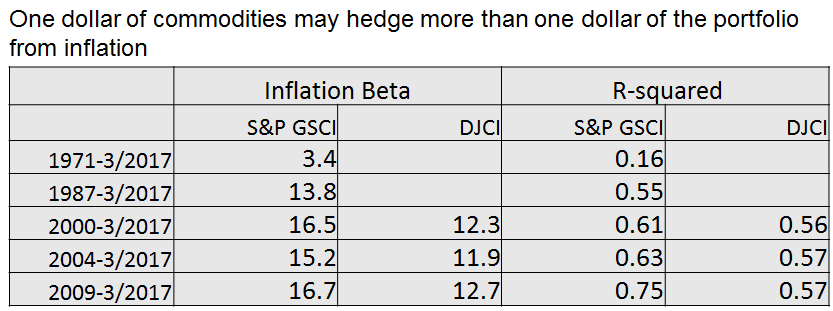
Inflation beta data are measured by CPI-U as listed on the website: ftp://ftp.bls.gov/pub/special.requests/cpi/cpiai.txt
R-squared signifies the percentage that inflation explains of the variability in commodity index returns
Inflation beta can be interpreted as: (using DJCI 2000-2017 as an example) A 1% increase in inflation results in 12.3% increase in return of the DJCI during the period from 2000–2017.
Time periods shown reflect first full year of returns for the S&P GSCI (1971), first year crude oil was included in the S&P GSCI (1987), first full year of returns for the DJCI (2000), 2004 and 2009 are 5-years and 10-years.
Not only is energy attractive from it’s inflation protection but many traders love it for its volatility. However some market participants prefer the lower volatility of gold and the safety it may provide in this environment of a weak financial sector, uncertain economic growth and political unrest. A mistake though is to assume gold will provide inflation protection because it doesn’t do a great job in that role. Since the launch of the S&P GSCI index in 1991, the excess return of copper over inflation is 5.1% versus gold of 3.5%, and the inflation beta or sensitivity to inflation is far higher for copper at 9.2 versus just 3.5 for gold. An investor can get almost triple the inflation protection from copper than gold. Oil still is far better with an inflation beta of 16.5 and excess return over inflation of 5.6%.
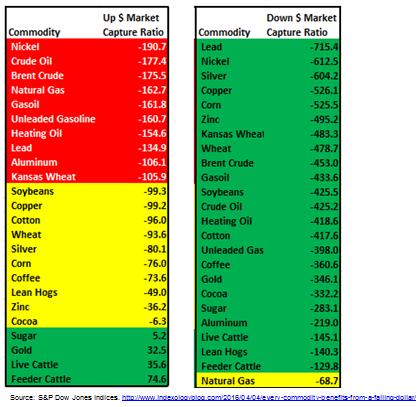
Last, if the fed decides not to raise rates, the dollar may fall significantly. In that case, every commodity may benefit, but again, the falling dollar doesn’t impact every commodity equally and the more economically sensitive copper and oil fare better than gold. On average for every 1% the dollar falls, copper gains on average 5.3%, Brent crude gains 4.5%, (WTI) Crude oil gains 4.3% and gold just 3.5%. What is interesting though is that when the dollar rises, gold actually rises on average, gaining 33 basis points for every 1% the dollar rises. A rising dollar also doesn’t hurt oil and copper as much as the falling dollar helps. For every 1% dollar rise, copper drops just 99 basis points and oil falls 1.8%.
Given the sensitivity difference, oil may better positioned than gold in the face of rising rates, the chance of a weaker dollar, and with concern about inflation.
The posts on this blog are opinions, not advice. Please read our Disclaimers.