Shorting VIX® was among the top strategies in the past year. XIV and SVXY both went up over 50% in Q1 2017 (~15% in March alone), almost doubled in the past six months, and returned ~180% over the past 12 months (see Exhibit 1). However, the declining VIX spot level can only explain part of their performance.

Both XIV and SVXY consistently provide a short exposure to VIX futures, not the spot VIX index. They are exchange-traded products that track the S&P 500® VIX Short Term Futures Inverse Daily Index, which, as its name suggests, seeks to track the inverse of the S&P 500 VIX Short Term Futures Index.
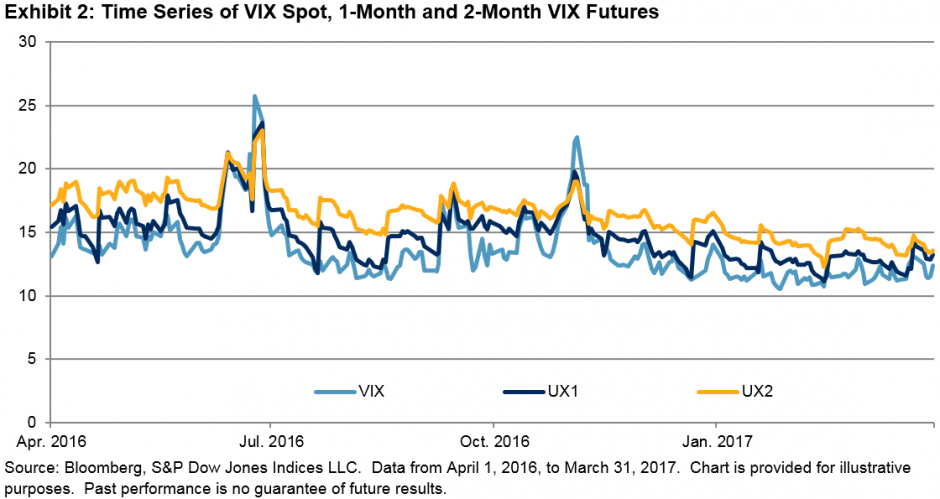
The S&P 500 VIX Short Term Futures Index takes long positions in the first- and second-month VIX futures contracts. A proportion of the first-month contract (ticker UX1) is rolled to the second month (ticker UX2) every day to maintain a constant 30-day maturity. As the second-month futures are usually more expensive than the first month (see Exhibit 2), this long VIX futures exposure usually incurs a loss from the roll (the “roll cost”), while the inverse of this exposure, as provided by the S&P 500 VIX Short Term Futures Inverse Daily Index, usually generates a profit from the roll (the “roll yield”).
The roll cost of the S&P 500 VIX Short Term Futures Index may seem small on daily basis, but in aggregate, it causes the index to go down over a long-term horizon. In the 12-month period (253 trading days), positive roll cost occurred on 247 days (97.63%). This is the main driver behind the enormous growth of inverse VIX futures products.
However, April 2017 will be an interesting month for VIX traders for a number of reasons.
First of all, the spread between the first-month and second-month VIX futures contracts has narrowed (see Exhibits 2 and 3). In addition to the reduction in roll yield of the short VIX futures exposure, the flattening of the VIX term structure usually indicates anxiety being built up in the market. In a distressed market, the VIX term structure may even become inverted, when the first-month futures become more expensive than those of the second month.

Secondly, the spread between the VIX spot and the 30-day realized volatility of the S&P 500 has tightened. As the benchmark of implied volatility, VIX is expected to be higher than the 30-day realized volatility of SPX. A tightened spread often indicates that the market is complacent and a VIX spike is on the way. When VIX spikes, the inverse VIX futures products usually incur losses.

Finally, risk coming from outside of the U.S., including the upcoming French election, should not be overlooked. As illustrated in Exhibit 5, the term structure of VSTOXX, a VIX-like index that measures the 30-day implied volatility of the Euro Stoxx 50 index, became inverted over the month of March 2017. As the European market is getting ready for the April 23, 2017 election, market participants in the states might need to fasten their seatbelts.

The U.S. equity market was resilient after Brexit and the U.S. presidential election, but how it will respond to the results of the French election is yet to be revealed. April could be an interesting month for all VIX investors, on the long or short side of the trade.
The posts on this blog are opinions, not advice. Please read our Disclaimers.