


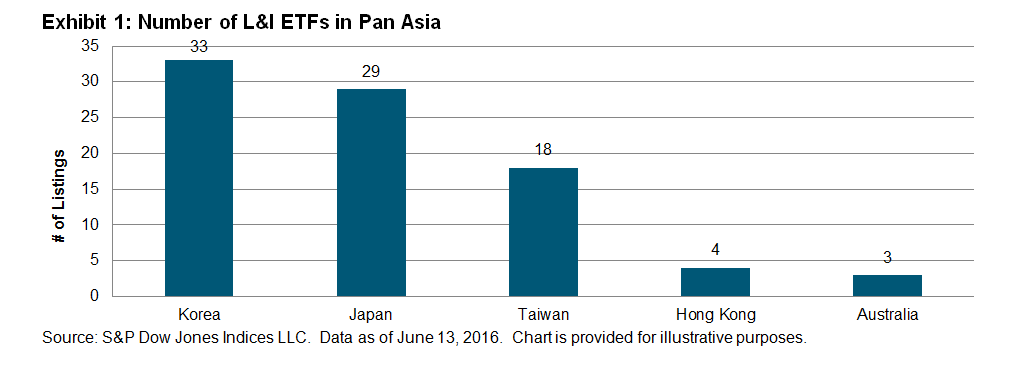
In recent years, leveraged and inverse (L&I) ETFs have gained significant traction in Asia. Thanks to the relaxation of listing regulations, more L&I ETFs are listing in Japan, Korea, Taiwan, Australia, and recently Hong Kong. The number of L&I ETFs listed in Asia is on the rise; it was up to 87 as of June 13, 2016 (see Exhibit 1).
The underlying indices of L&I ETFs are using different strategies. Leveraged indices are designed to generate a multiple of the return of the underlying index in situations where the investor borrows funds to generate index exposure beyond their cash position. Inverse indices are designed to provide the inverse performance of the underlying index, representing a short position in the underlying index.
L&I ETFs Drive Turnover in Asia
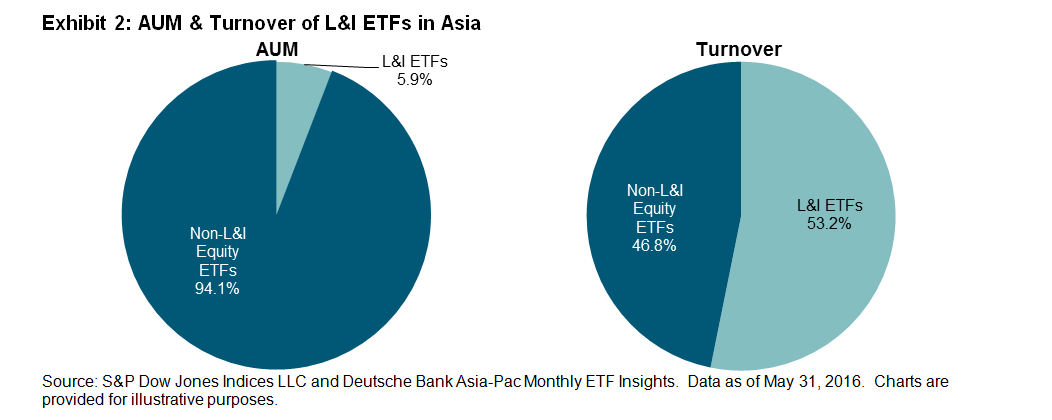
The growth of AUM and the turnover of L&I ETFs have outpaced those for other non-L&I equity ETFs in the Pan Asia region. This year, the AUM of L&I ETFs grew 6.8%, while other equity ETFs only increased 2.8%. The turnover of L&I and non-L&I equity ETFs showed a significant difference, with -7.1% and -61.9%, respectively.* It is worthwhile to highlight that the amount of AUM of L&I ETFs in the Pan Asia region is rather low, but the turnover is high when compared to other equity ETFs. According to the data released by the Taiwan Stock Exchange, ETF turnover in Taiwan has increased by 45% to 299.5 million units (YoY 2015), and this growth was mainly driven by the strong demand of L&I products. Taking a look at the bigger picture in Pan Asia, L&I ETFs only represent 5.9% of the total AUM, but they garnered 53.2% of total turnover and thereby bolstered the market liquidity (see Exhibit 2).
Hong Kong Opens Door for L&I Products
To tap into Asian demand for L&I products, Hong Kong finally opened its doors to allow the listing of those products. The first batch of L&I products have been launched in Hong Kong to bet on and against mainly overseas markets, given that only non-Hong Kong and non-mainland indices were eligible originally. There are other L&I products in the pipeline, and they are expected to come to the market soon. Hong Kong has long been thought of as a market with a lack of product innovation and has fallen behind Tokyo and Shanghai by turnover in the region. With the new L&I listings in Hong Kong, we will see if its market can follow in the examples of Japan, Korea, and Taiwan in their boosting of ETF turnover.
L&I ETFs are becoming more popular, as they may serve as trading tools for investors to potentially amplify returns regardless of market direction. However, investors should be aware that L&I products, unlike conventional ETFs, are designed for short-term trading and associated with potential risks such as daily compounding and daily rebalancing.
The posts on this blog are opinions, not advice. Please read our Disclaimers.


 Source: S&P Dow Jones Indices LLC. Data as of June 13, 2016. Chart is provided for illustrative purposes.
 The
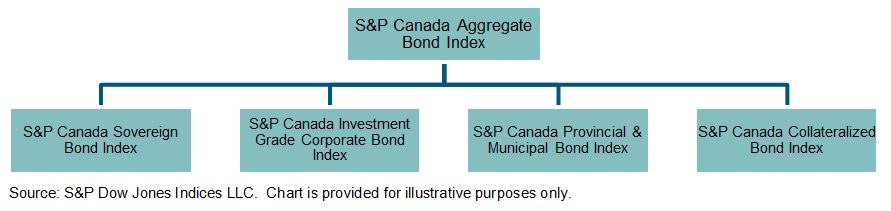
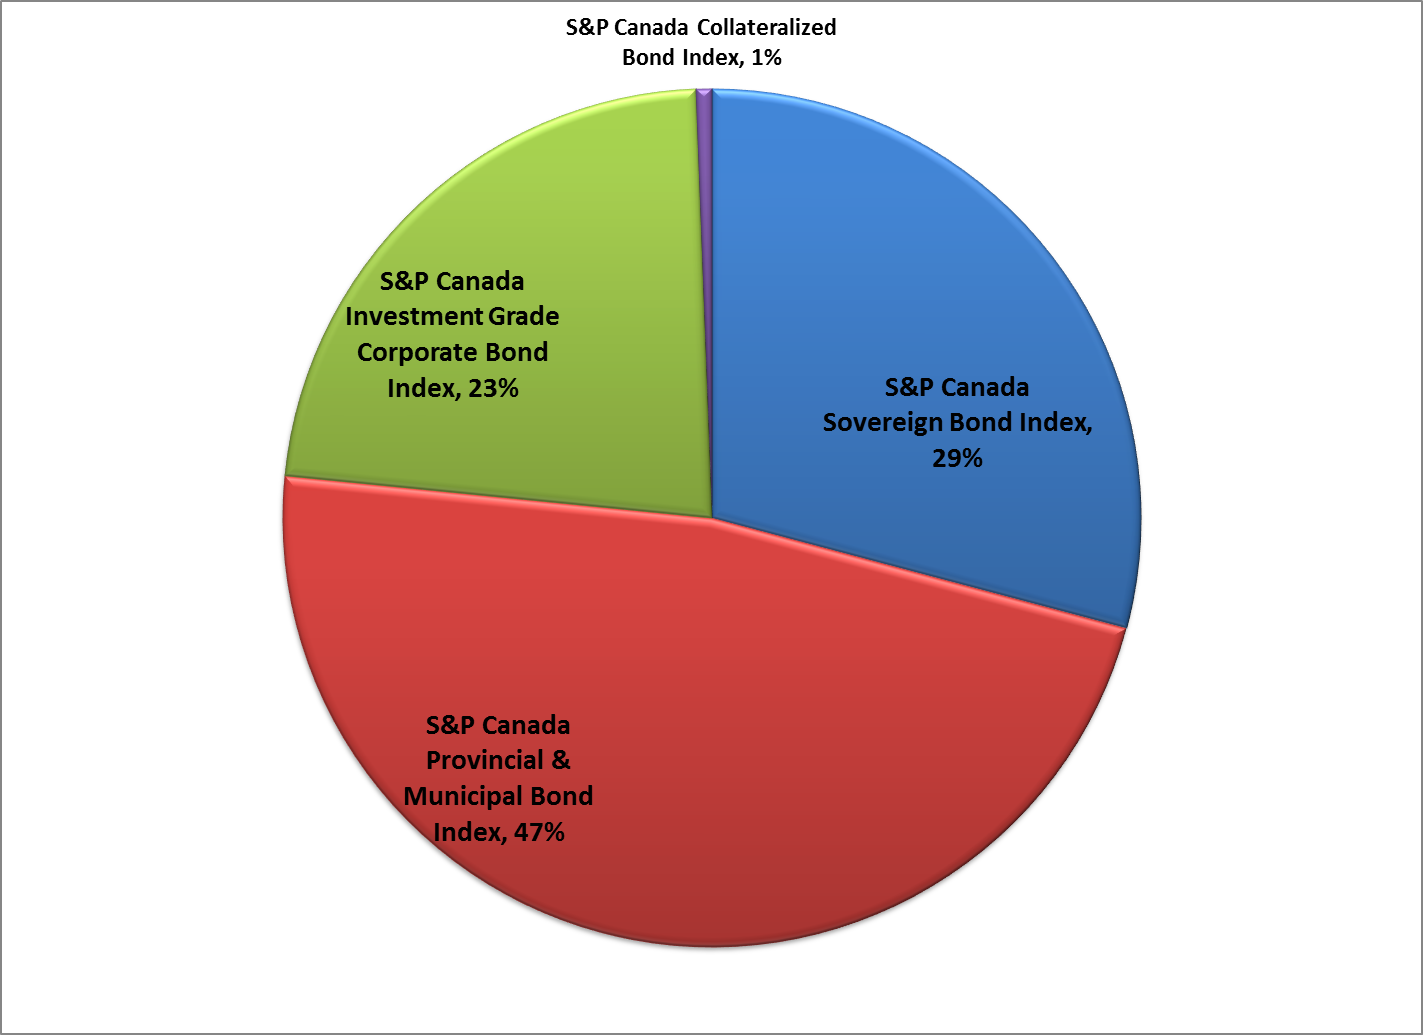
The 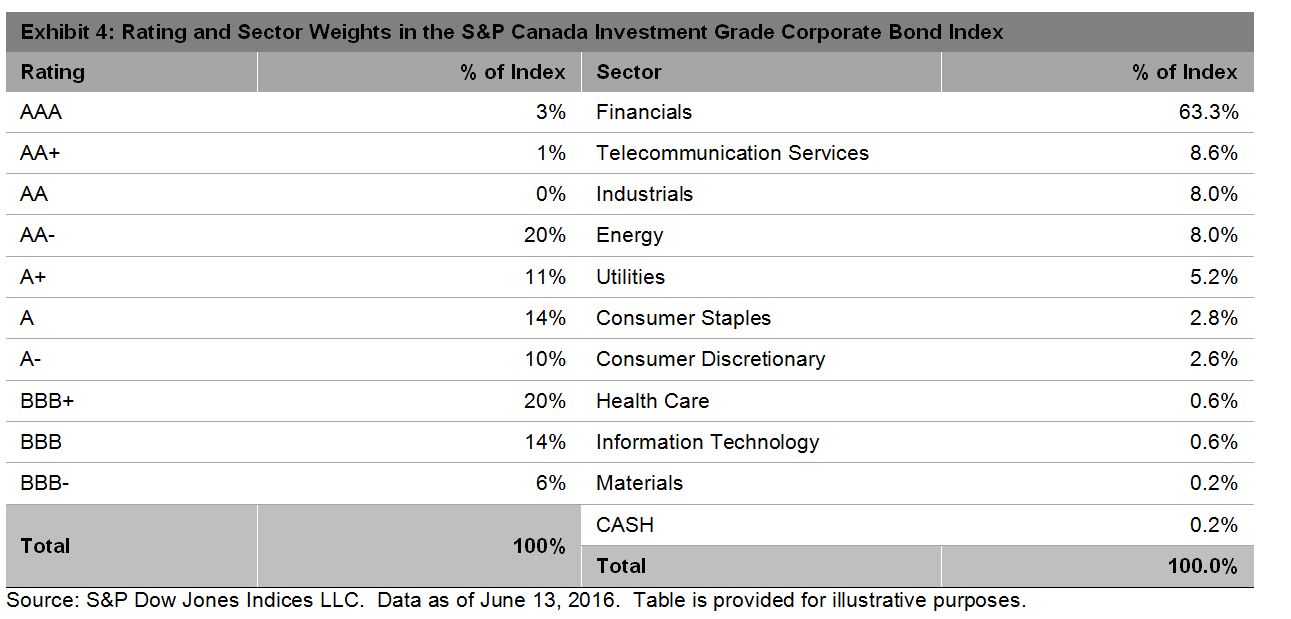 The collateralized sector of the market accounts for a small percentage of the index, less than 1%. The