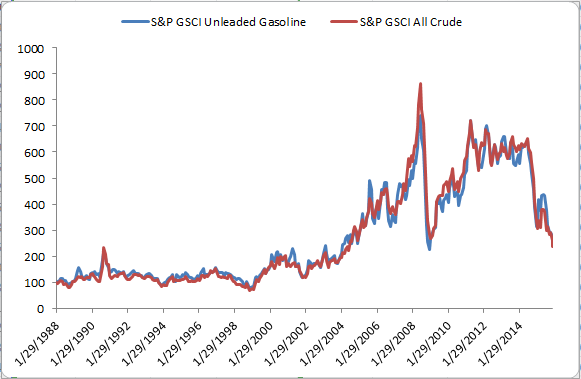
An alarming picture is being painted by an economically frail global economy: the threat of a U.S. Fed rate hike and renewed credit weakness driven by falling oil prices. The S&P GSCI® (TR) was down 30.8% YTD, with all sectors in the index reporting negative returns for the year, but the S&P 500® and the U.S. stock market have not collapsed yet. In fact, U.S. equities are on pace to outperform commodities for the eighth consecutive year, which would set a new record. If this cycle changes, investors may need a way to protect themselves.
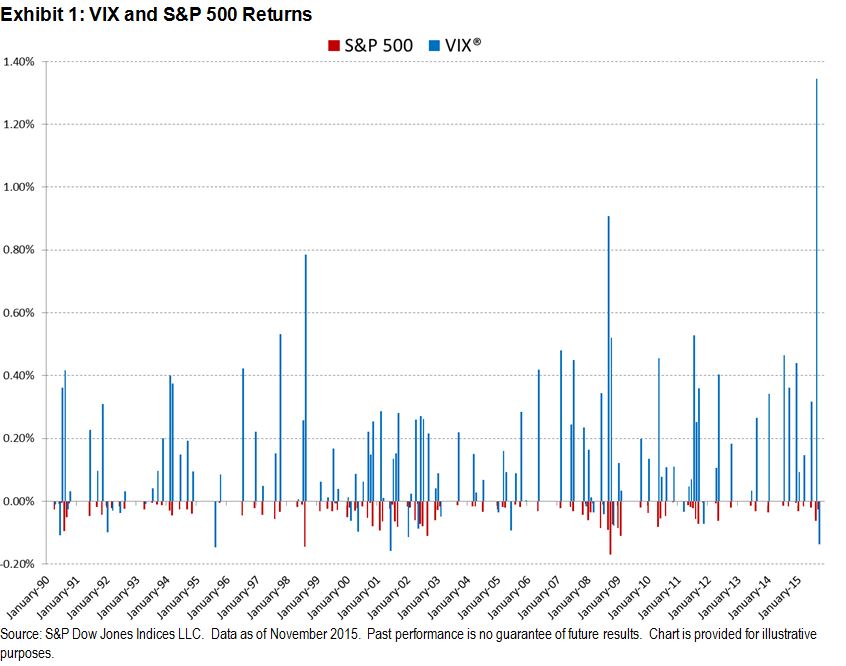
Historically, the CBOE Volatility Index® (VIX), which many investors know as the “investor fear gauge,” tends to spike when markets are tumultuous. VIX measures the expected 30-day volatility of the S&P 500. When implied volatility is high, the intraday moves can be large, and when implied volatility is low, intraday ranges tend to be narrow.
Since 1990, the S&P 500 has dropped in 37% of months (115 out of 300) and on average, when it fell, it lost 3.5%. When VIX gained, it gained an average of 16.4%. In October 2008, the S&P 500 lost 16.9%, its worst month on record, while VIX gained 52.0% in the same period.
Exhibit 1 shows VIX and S&P 500 returns when equities are in negative territory. It can be seen that in most cases where S&P 500 returns are negative, VIX returns are positive.
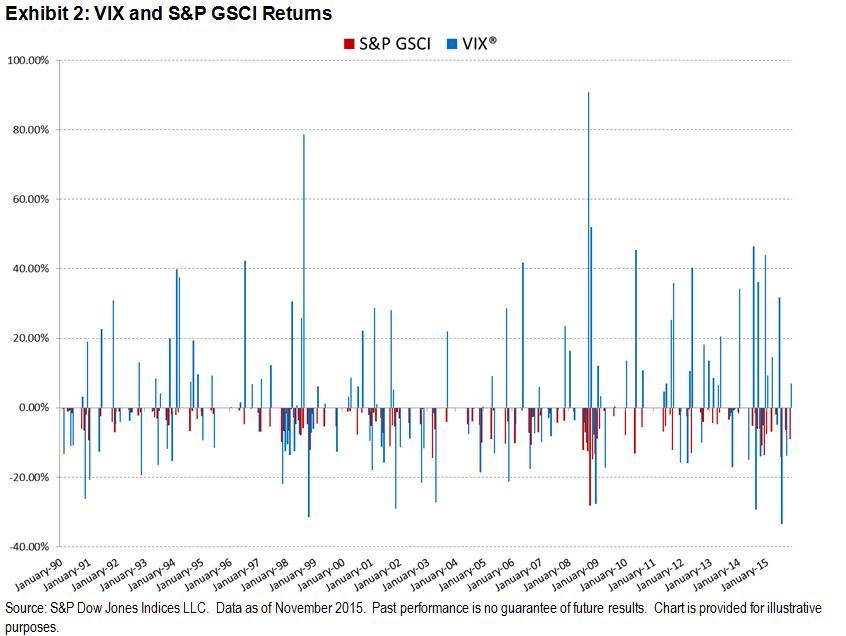
Since the current commodity crash has played a major role in slowing global growth, it is important to note that VIX could also protect against drops in commodity prices. Since 1990, the S&P GSCI has fallen in 46% of months (142 out of 311). In those months, on average, commodities fell 4.7% and VIX gained 3.4%. Exhibit 2 shows VIX and S&P GSCI (TR) returns; when commodities are in negative territory, it can be seen that in most cases VIX returns are positive.
Volatility indices like the S&P/ASX 200 VIX, the S&P/JPX JGB VIX, and the S&P/TSX 60 VIX could offer similar protection globally.
The posts on this blog are opinions, not advice. Please read our Disclaimers.