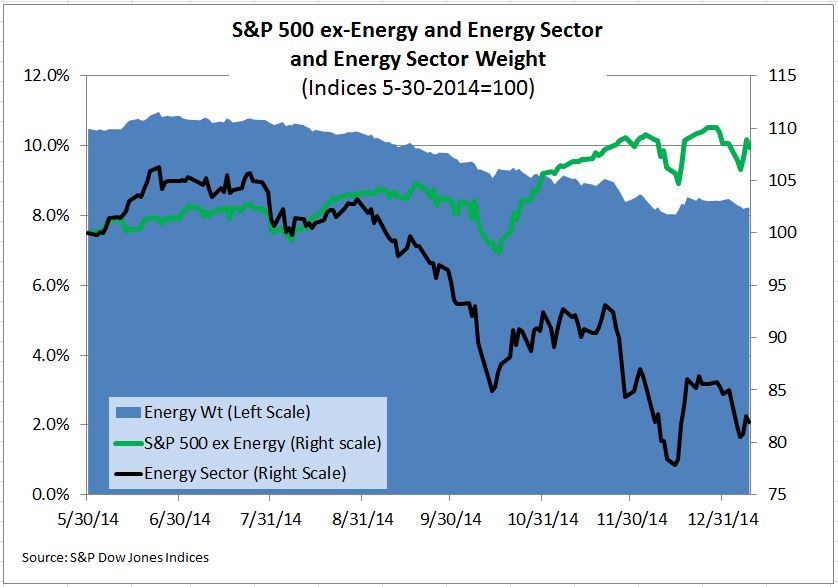
From May 30th 2014 to last Friday, January 9th, the energy sector in the S&P 500 was down 18.1% while the overall index was up 6.3%. As energy under-performs the overall index, its weight within the index is dropping, reducing the impact of further energy weakness on the index. The energy sector weight is down by more than a fifth, from 10.8% at the end of May to 8.2% last week.
The nature of a market cap weighted index is to adjust to mitigate the damage, or take advantage of, a trend as long as the trend is maintained. The weight of any stock, or sector, in the index is simply the ratio of its market value to the total market value of the index. If energy stocks drop by one percent today and the rest of the index rises (or falls by less than one percent), the energy sector weight will drop and the weight of the other sectors will rise. If the energy sector steadily and consistently falls compared to the rest of the market, its weight falls. For an investor holding a portfolio tracking the S&P 500, a one percent loss in energy today is less damaging than a one percent energy loss was last summer. This may sound like almost magical risk management – the more energy under-performs, the smaller the exposure. There is one caveat: when oil prices bottom out and begin to rise, the exposure to oil and energy will have been minimized. At the exact moment when an investor wishes to be over-weighted in energy, she would be under-weighted.
Those who remember the end of the tech stock boom in March 2000 saw the same process in the other direction. For two or three years, tech stocks led the market up and month by month the tech sector weighting in the S&P 500 climbed from about 15% to a third of the index. But when techs crashed, the entire market was over-weighted in the wrong direction.
The chart shows the performance of the energy sector of the S&P 500 and the S&P 500 excluding energy as well as the energy sector weight (the shaded region).


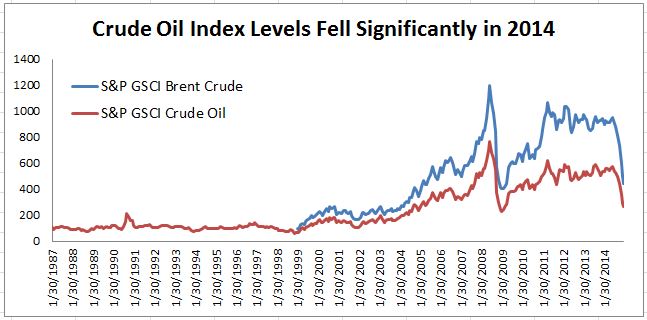 Source: S&P Dow Jones Indices. Data from Jan 30, 1987 to Jan 8, 2015. Past performance is not an indication of future results.