


Congratulations to the Chicago Blackhawks on their awesome win last night! I must admit I was very excited watching the most amazing finish I have ever seen in hockey, but as a commodity lady my first thought was about the metal in the Stanley Cup and what is it worth, especially given the current environment of a strengthening U.S. dollar and rising U.S. bond yields.
From the economic backdrop, silver and nickel, the two metals that form the cup, are the worst performing metals in their respective sectors. Year-to-date in 2013, the S&P GSCI Silver is down 35.8% and the S&P GSCI Nickel lost 20.8%. The cup is made up of 97% silver and 3% nickel, so just for fun, we thought we would chart a “Stanley Cup Index” to reflect historical levels of the alloy.
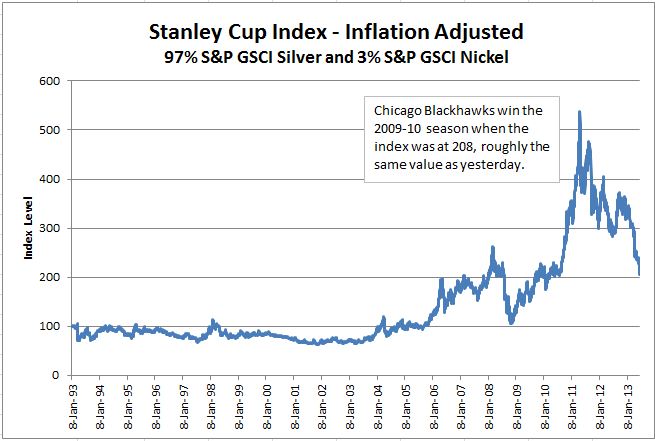
Who won the most valuable Stanley Cup? The last time the Chicago Blackhawks took the title, the cup had about the same value as yesterday, only slightly higher at 213 versus yesterday’s level of 205. However, while they were holding it, the index increased 153% to a high value of 538 on April 29, 2011 – just before the Boston Bruins would take it over but at a value 27% off the high at an index level of 391.
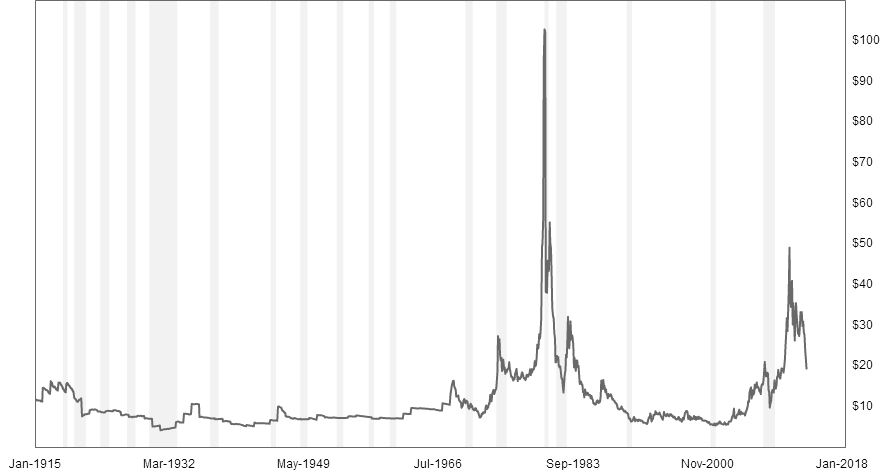
Although our hypothetical “Stanley Cup Index” only begins 20 years ago, as far back as we have the single commodity index data for nickel, there was a time where the cup was worth more. To illustrate roughly the cup in history as far back as 1927, the first time the Cup was solely contested by National Hockey League teams, one can look at the historical silver prices on an inflation adjusted basis. The approximate value of the original cup (100% sliver,) the historical price can be multiplied by the weight of 459.74 troy oz. According to this method, for example, yesterday the price was roughly $19.50 so the value of the cup was about $8,964.93. According to the chart, in 1979, when the Montreal Canadiens won, the value was approximately $12,307.24 and rose to a value of about $47,256.67 by Jan 1980. Not unlike the 2010-11 drop before the Bruins last won, the value of the cup dropped 55% to roughly $21,106.66 before the New York Islanders earned it.
Updated: June 25, 2013 at 8:57 AM EDT Series: historical gold prices – economic indicators
In both the recession of the early 80’s and post the global financial crisis of 2008, correlations spiked from an aggregate increase in demand. This only happened one other time in history post the 2001 tech-bubble bust. Stay tuned for more about correlations.
The posts on this blog are opinions, not advice. Please read our Disclaimers.

