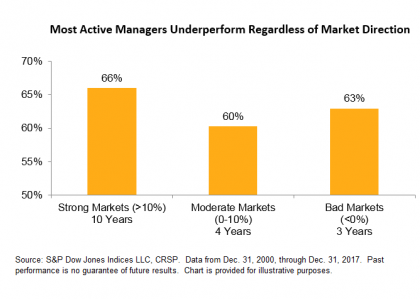
Recently, a number of reports highlighted a surge in popularity for actively managed U.S. equity funds in 2019. The main explanation for this trend appears to be the volatility observed in the final few months of 2018: market participants seem to believe active managers are better able to navigate more volatile markets. However, the data belies this belief: most active managers underperform regardless of market direction.

One possible explanation for the underperformance of active managers involves their typical bias towards high beta, more volatile stocks. Given many funds target 100% participation in market gains, but they may maintain a non-zero allocation to cash equivalents (in order to meet operational needs, for example), many active managers may be obliged to bias their portfolios towards stocks with a higher-than-average sensitivity to market movements. However, given their higher betas, these stocks generally fall by more than the market during more turbulent times. In contrast, we expect less volatile stocks (such as constituents of low volatility indices) to be better insulated against market downturns.
Exhibit 2 shows the possible impact of active managers’ apparent preferences for more volatile stocks: while most U.S. large-, mid-, and small-cap funds lagged their respective benchmarks in most calendar years, the extent of the underperformance was higher in years when low volatility indices fared relatively well. For example, on average, 58.13% (67.97%) of U.S. large-cap equity funds lagged the S&P 500 in the five years when the U.S. equity benchmark posted the best (worst) annual excess returns. Similar results can be seen for mid- and small-cap managers, based on the relative performance of the S&P MidCap 400 and S&P SmallCap 600 to their respective low volatility indices.

So how did low volatility indices perform in 2018? The S&P 500 Low Volatility, S&P 400 Low Volatility, and S&P 600 Low Volatility indices all beat their cap-weighted counterparts last year. And the annual excess returns for each of the low volatility indices ranked 6th, 3rd and 9th, respectively, across all years since 2001.

As a result, we will have to wait for our year-end 2018 U.S. SPIVA numbers to see how active managers fared against their benchmarks in 2018. However, historical evidence suggests the relative performance of low volatility indices – among other factors – may be a sign that active managers struggled to beat their benchmarks amid the recent market jitters.
The posts on this blog are opinions, not advice. Please read our Disclaimers.


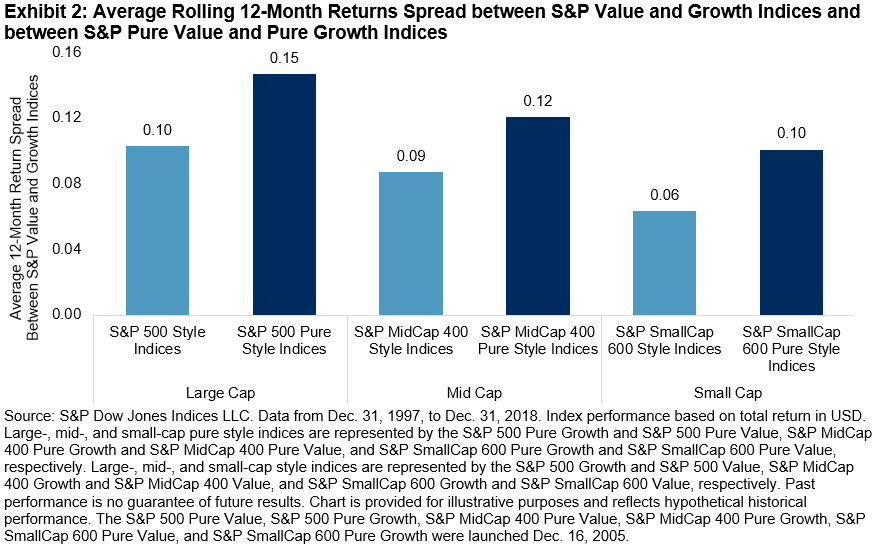
 The relative performance of value and growth indices moves in cycles over time, thus market participants could potentially make tactical adjustments to take advantage of short-term deviations in relative value. Exhibit 2 illustrates the style return spread (value minus growth) for the large-cap, mid-cap, and small-cap style and pure style indices.