Get Indexology® Blog updates via email.

In This List

Considering REIT Lease Durations in a Rising Rate Environment

Laddered Protection

How Much Will My Retirement Income Cost? Part 1

The Evolution of Indian Indices

How Global Are the S&P 500®, the S&P MidCap 400®, and the S&P SmallCap 600® Style Indices?

Considering REIT Lease Durations in a Rising Rate Environment

Contributor Image
John Welling

Director, Global Equity Indices

S&P Dow Jones Indices

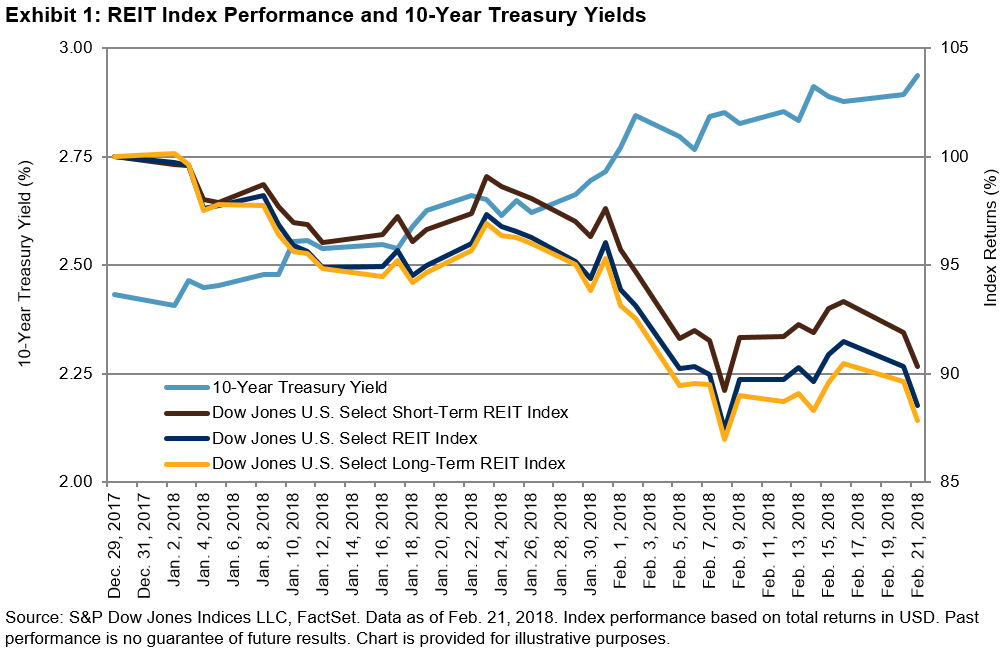
U.S. REITS have been lagging broad U.S. equities. During the recent climb in 10-year Treasury yields from the 2018 low of 2.41% on January 2, to as high as 2.94% on February 21, the Dow Jones U.S. Select REIT Index declined 11.2%. Though we have found that REITS have generally fared well over full cycles of rising rates, periods of sharper increases tend to weigh heavily on the minds of REIT investors.

However, REITs with shorter-term lease durations—apartments, hotels/resorts, manufactured homes, and self-storage—have generally fared more favorably. Theoretically, these REITs should be less sensitive to interest rates since they can reprice their rental agreements more quickly. The performance of the Dow Jones U.S. Select Short-Term REIT Index[1] illustrates this concept well, falling a lesser 9.3% over the same period, while its counterpart, the Dow Jones U.S. Select Long-Term REIT Index, fell 12.3% (see Exhibit 1).

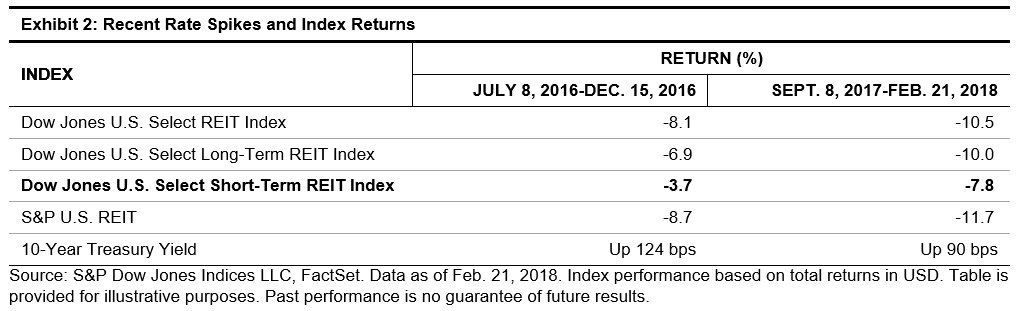
If we expand the data to include the full run of the two most recent spikes in rates, we see that the Dow Jones U.S. Select Short-Term REIT Index has outperformed benchmark REIT indices. The performance of the Dow Jones U.S. Select REIT Index has been somewhat insulated by its exclusion of net-lease REITs, which tend to have relatively high sensitivity to interest rates. For this reason, we have also included the S&P U.S. REIT, which includes net-lease REITs as an added comparison (see Exhibit 2).

The Dow Jones U.S. Select Short-Term REIT Index has significantly outperformed the broader REIT market over the long run, with modestly lower volatility. This effect seems to be a byproduct of the index’s less-severe drawdowns during periods of rapidly rising rates.

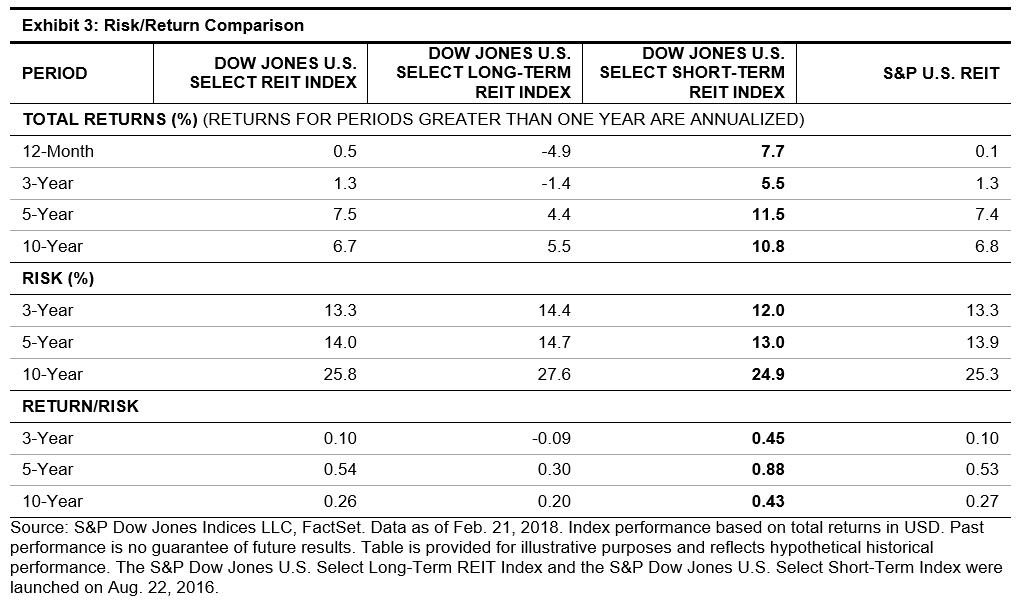
It may be a good time for REIT investors to consider the duration of their REIT holdings. The Dow Jones U.S. Select Short-Term REIT Index may offer beneficial risk/return characteristics when compared to benchmark REIT indices, particularly during periods of rapidly rising rates.

[1]   https://spindices.com/documents/education/talking-points-dj-us-short-term-reits.pdf

The posts on this blog are opinions, not advice. Please read our Disclaimers.

Laddered Protection

Contributor Image
Kevin Horan

Former Director, Fixed Income Indices

S&P Dow Jones Indices

Continuing the theme of rising interest rates and following up from my last blog, “With all the News of Higher Interest Rates, Don’t Forget About Floating-Rate Debt,” bond laddering is a strategy that provides increased income and the ability to adjust the stream of income in a rising-interest-rate environment. The approach is to invest in specific maturity dates, or “rungs” of the ladder. For example, if you wanted to create a bond ladder today, you could buy bonds maturing in 2019, 2020, 2021, and so forth. The products used for such a strategy can vary, but are usually U.S. Treasury bonds, U.S. Municipal bonds, or corporate bonds.

S&P Dow Jones Indices has published many articles that address this topic. The educational paper, “Laddering a Portfolio of Municipal Bonds,” is a detailed piece that covers the construction and benefits of this kind of strategy.

To many people, the most important part of creating a bond ladder designed to preserve capital and build wealth in a rising-rate environment is buying individual bonds or defined-maturity ETFs.

However, it’s possible to keep a bond ladder intact by reinvesting that cash into a new longer-dated instrument. By rolling the proceeds into a longer-dated instrument, every time a shorter one matures, it’s possible to create a reliable income stream that may rise with interest rates over time.

Indices can be a helpful way to study the performance of a ladder strategy and the income producing result of the strategy in an increasing interest rate environment. In some cases, the index may have an investable ETF or ETP product issued against it, which gives an investors access to that segment of the market.

The indices in Exhibit 1 have been designed for use in laddering strategies.

Exhibit 1: Indices Designed for Laddering Strategies (Total Returns)

Source: S&P Dow Jones Indices LLC. Data as of Feb. 28, 2018. Chart is provided for illustrative purposes.

 For more information, please see these additional laddering articles:

Navigating Rising Rates: Municipal Bond Ladders by Matt Tucker

The Tactical Case for Bond Ladder ETFs by Matthew Forester

Fixed Income Laddering by Kevin Horan

Advisors Managing Interest Rate Risk With Municipal Bond Indices and ETFS by Shaun Wurzbach

Applying a Laddering Strategy to Preferred Portfolios in Canada by Phillip Brzenk


The posts on this blog are opinions, not advice. Please read our Disclaimers.

How Much Will My Retirement Income Cost? Part 1

Contributor Image
Wes Crill

Vice President, Research

Dimensional Fund Advisors

Gaining clarity around the future spending, or consumption, that an investor’s savings can support is critical in planning for retirement. Being armed with information about retirement preparedness can inform one’s decisions about savings rate, expense budget in retirement, and investment selections. A first step towards solving this challenge is to understand how much retirement income costs.

One way to visualize retirement income is as a string of cash flows that fund a retiree’s consumption—the “retirement income liability”. The objective for investors is to fund these cash flows from current and future savings. Each of these cash flows has a price that is known from today’s bond yield curve. For example, the interest rate on a 10-year zero coupon US Treasury bond can be used to infer the present value[i] of a cash flow 10 years from now.

This framework suggests two primary risks that increase uncertainty about the degree to which current savings can support the retirement income liability. First, since the present value of future cash flows depends on interest rates, the cost of the liability is sensitive to interest rate changes. For example, if interest rates go up, the liability cost will go down, and vice versa. In addition, retirement consumption is likely to be in goods and services that rise in cost with inflation. Higher inflation means today’s savings do not have the same purchasing power in the future.

The S&P Shift To Retirement Income and Decumulation (STRIDE) Index Series can help cut through the fog of uncertainty.[ii] STRIDE Indices define a retirement income goal of $1 of inflation-adjusted income for 25 years, i.e., the Generalized Retirement Income Liability or “GRIL.” This definition assumes an average life expectancy of 20 years, beginning at age 65, plus a five-year buffer to account for uncertainty about life expectancy. Using real interest rates taken from available Treasury Inflation-Protected Securities (TIPS), S&P discounts each future $1 and adds them up to compute the present value of the GRIL, as shown in Exhibit 1.

Chart is provided for illustrative purposes. Assumes that the first dollar of income is received at the end of the first year of retirement. Present value calculation assumes a hypothetical discount rate[iii] of 2%.

With this number, we can meaningfully translate a retirement account balance into expected future consumption. Dividing the current balance by the cost of income (the GRIL) provides an estimated annual income stream in retirement. This number is equivalent to the value, in real terms, that can sustainably be withdrawn each year for consumption during the retirement period.

These insights can help inform what an investment solution should look like. An investment solution integrated with the goal of retirement income should focus on reducing volatility in the ratio of account balance to cost of income, which reduces uncertainty in the income estimate. To learn more about how the S&P STRIDE Index Series incorporates a retirement income focus into its design, tune in for part 2 tomorrow.

Important Information

In response to the need for income-focused benchmarks within defined contribution plans, on January 11, 2016 S&P Dow Jones Indices (S&P DJI) launched the S&P Shift to Retirement Income and DEcumulation (STRIDE) Index Series.

The series features multi-asset class income-based indices tied to target retirement dates. Dimensional Fund Advisors worked collaboratively with S&P DJI to develop the glide path, inflation hedging, and duration hedging techniques used in these indices.

Disclosures

The S&P STRIDE INDEX is a product of S&P Dow Jones Indices LLC or its affiliates (“SPDJI”) and has been licensed for use by Dimensional Fund Advisors LP (“Dimensional”). Standard & Poor’s® and S&P® are registered trademarks of Standard & Poor’s Financial Services LLC (“S&P”); Dow Jones® is a registered trademark of Dow Jones Trademark Holdings LLC (“Dow Jones”); these trademarks have been licensed for use by SPDJI and sublicensed for certain purposes by Dimensional. Dimensional’s products, as defined by Dimensional from time to time, are not sponsored, endorsed, sold, or promoted by SPDJI, S&P, Dow Jones, or their respective affiliates, and none of such parties make any representation regarding the advisability of investing in such products nor do they have any liability for any errors, omissions, or interruptions of the S&P STRIDE Index.

Dimensional Fund Advisors LP receives compensation from S&P Dow Jones Indices in connection with licensing rights to the S&P STRIDE Indices. It is not possible to invest in an index.

Dimensional Fund Advisors LP is an investment advisor registered with the Securities and Exchange Commission.

[i] A ”present value” is how much a future sum of money is worth today.

[ii] To learn more about the S&P STRIDE Index Series, see S&P STRIDE Index Series Methodology, available at us.spindices.com.

[iii] A discount rate is the rate used to transform future cash flows into today’s dollars.

The posts on this blog are opinions, not advice. Please read our Disclaimers.

The Evolution of Indian Indices

Contributor Image
Alka Banerjee

Former Managing Director, Product Management

S&P Dow Jones Indices

A recent stipulation by SEBI for the mutual fund industry outlines how to treat size classifications and suggests that funds need to be very explicit in their stock selection and fund categorization when it comes to stock sizes. SEBI laid down rules for categorizing funds based on component stock sizes and fund houses have to adopt the rules by the first quarter of 2018. Index providers in India have been providing size indices for many years but index selection by asset managers has tended to disregard these criteria in favor of more customized approaches. As investor attention in India has focused more on indices, the natural value that indices bring to investors has grown in importance. Indices provide transparency, rules and a clean structure to the investment landscape and the result can be beneficial for investors.

In India, the quality and design of indices has evolved considerably over time. With the partnership of S&P DJI with the BSE, for the first time the benefits of global indexing standards were brought to the local market. In the last four years alone, Asia index Pvt. Ltd (Asia Index) has launched more than 75 new indices ranging from size, sector, thematic and smart beta. Indices are designed to provide a range of investment choices and Asia index has striven to do just that. On the one hand we have the S&P BSE 30, a liquid investable gauge of the Indian stock market and on the other we also have the S&P BSE AllCap index which is a broad comprehensive index series covering more than 90% of the total market capitalization of the market and is modular with an ability to slice as per size, sector and industry. Similarly smart beta indices for low volatility, value and momentum and other factors are all offerings available to the India investor. Most recently, an ESG (environmental, social and corporate governance) index which selects stocks based on their ESG scores has been launched. Fixed income indices have been available from CRISIL for some time too and have been quite popular with investors.

While the use of indices is just beginning to take off in India, the rapid growth in the number of new index launches from various providers has grown exponentially, with the expectation that markets are maturing rapidly and demand for well-designed and indices will ratchet up. The world of indexing is constantly growing and evolving and the Indian index providers have geared up to match the global pace.

The posts on this blog are opinions, not advice. Please read our Disclaimers.

How Global Are the S&P 500®, the S&P MidCap 400®, and the S&P SmallCap 600® Style Indices?

Contributor Image
Phillip Brzenk

Managing Director, Global Head of Multi-Asset Indices

S&P Dow Jones Indices

In a prior post, we looked at the global exposure of the S&P 500. Given the large number of multi-national corporations based in the U.S., approximately 29% of S&P 500 revenues came from overseas in 2017. Beyond large-cap companies, do regional and country exposures change as investment style changes? In this blog, we add to the analysis performed on the S&P 500 and look at the differences in revenue exposure across the nine U.S. style boxes.

This analysis could potentially aid in understanding the differences between the indices beyond looking at size, fundamentals, or sector weights. We look at revenue exposure of the indices on a regional level, as well as on the country level. In addition, we review the total percentage of companies that are purely domestic in terms of revenue origination.

On a regional basis, the large caps have a higher level of geographic diversification compared to the smaller size segments. In addition, growth is more geographically diverse than value for large and mid caps, while the two styles have a similar level of revenue distribution in small caps. In particular, the revenue exposure to the Asia-Pacific region for growth is higher than the blend (overall benchmark) and value for both the S&P 500 and the S&P MidCap 400.

Small caps have the highest domestic exposure, at 79% of total sales, with mid caps sitting at 73%, and as mentioned previously, large caps at 71%. The trend of increasing U.S. exposure as one moves down the size scale is not surprising. Among other reasons, smaller companies are generally less mature and have less capital to grow their businesses internationally.

There is little differentiation in U.S. revenue exposure between growth and value for small- and mid-cap companies. However, in the large-cap space, growth (65% U.S. revenue) is more foreign-oriented than value (73% U.S. revenue) by a considerable amount. One driver of this is the relatively higher exposure that growth has to China at 5.6%, while value has an exposure of 3.8%.

Exhibit 3 lists the percentage of companies that only have domestic U.S. sales for each investment style. Nearly 23% of companies in the S&P 500 only obtain revenues from the U.S., but that figure jumps to 35% for the S&P MidCap 400, and 42% for the S&P SmallCap 600.

In terms of percent of holdings, nearly double the amount of small-cap companies are purely domestic compared to large-cap companies. When comparing large-cap growth to small-cap growth, the difference is more pronounced. In the S&P 500 Growth, just 15% of companies get all sales from the U.S., whereas the figure stands at 43% for the S&P SmallCap 600 Growth.  Overall, growth tends to include more geographically diversified companies, while value includes more purely domestic companies.

As we demonstrated, there are notable differences in the geographic sources of revenue among the domestic equity size and style indices. Further testing is required to establish whether cross-sectional differences in revenue origination explain return differences. However, at a minimum, market participants may need to keep in mind that certain market or economic events may affect a company or portfolio economically, and that impact could potentially be explained by where revenues come from geographically, and not just from its size (market-cap), fundamentals (growth/value), or line of business (sector/industry).

The posts on this blog are opinions, not advice. Please read our Disclaimers.