Get Indexology® Blog updates via email.

In This List

Rising Interest Rates – Boon or Bane for Pan Asian Dividend Strategies?

Bridging the Volatility Gap between IG and HY

Reading between the lines of China’s “Twin sessions”

Rieger Report: Why foreign investors like U.S. municipal bonds

Rising Rates Arrive

Rising Interest Rates – Boon or Bane for Pan Asian Dividend Strategies?

Contributor Image
Utkarsh Agrawal

Associate Director, Global Research & Design

S&P Dow Jones Indices

In December 2016, the U.S. Fed raised the interest rate for the second time in the current rate hike cycle.  Three more rate hikes were expected for this year, one of which took place in March.  In a low interest rate environment, companies that have increasing dividends or offer high dividend yields look attractive to income-seeking market participants.  But the yield offered by these companies may be considered less competitive in a rising interest rate environment.  Exhibit 1 shows how various S&P DJI Asian dividend and REIT indices have performed in U.S. interest rate cycles since 2004.

During the U.S. rate hike cycle that began June 30, 2004, and lasted until the first rate cut on Sept. 18, 2007, the three S&P Dow Jones Asian Dividend Indices examined, as well as the S&P Pan Asia REIT Index, significantly outperformed the Pan Asia equity benchmark, the S&P Pan Asia BMI, and the S&P U.S. Treasury Bond 7-10 Year Index (see Exhibit 1).  However, in the next rate cut cycle lasting from Sept. 18, 2007, to Dec. 17, 2015, the performance trend of these indices reversed, most likely due to the impact of the global financial crisis.  The returns of all three Asian dividend indices and the S&P Pan Asia REIT Index lagged the equity benchmark and the S&P U.S. Treasury Bond 7-10 Year Index.  The Dow Jones Asia/Pacific Select Dividend 30 Index even recorded negative returns in this rate cut cycle.

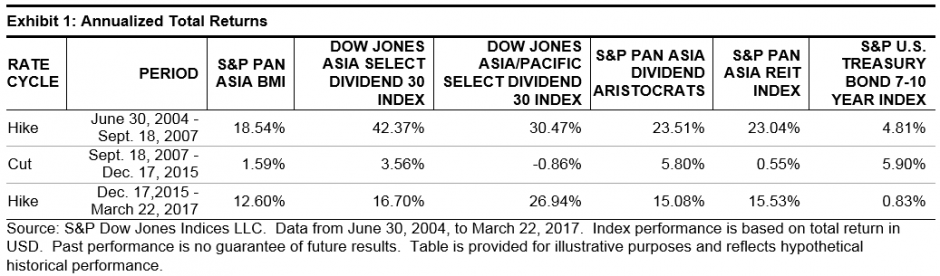
In the most recent rate hike cycle starting Dec. 17, 2015, the three Asian dividend indices and the S&P Pan Asia REIT index again delivered significant excess returns compared to the S&P Pan Asia BMI and the S&P U.S. Treasury Bond 7-10 Year Index.

Exhibit 2 shows the yield spread of various dividend indices versus the yield-to-maturity of the S&P U.S. Treasury Bond 7-10 Year Index since Dec. 17, 2015.  Apart from the S&P Pan Asia Dividend Aristocrats, both the Dow Jones Dividend Indices and the S&P Pan Asia REIT Index maintained yield spreads of more than 2% after three rate hikes.  The S&P Pan Asia REIT Index maintained the most stable yield spread throughout the period studied.

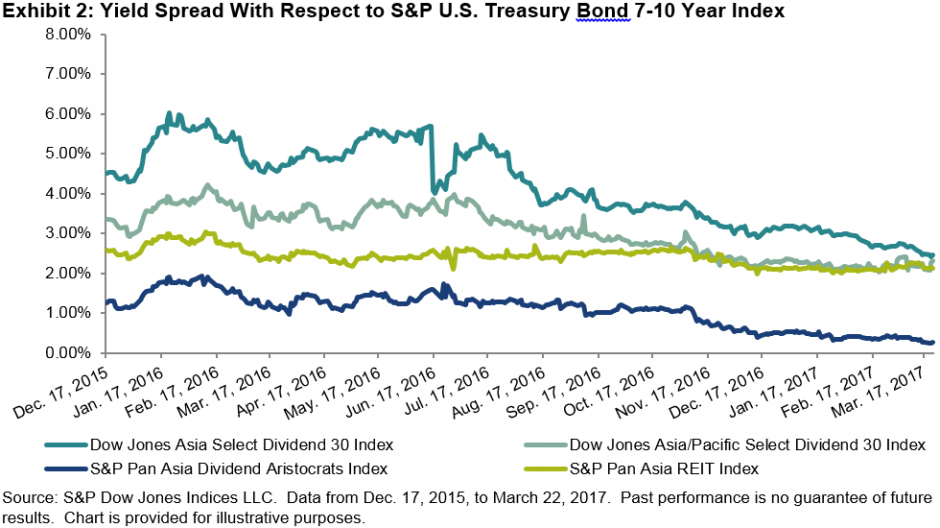
While market participants may expect interest rate hikes to negatively affect Asian high-yield stock performance, it is notable that their performance has been much more sensitive to economic cycles than to U.S. interest rate cycles over the past decade.  For the Dow Jones Asian Dividend Indices and the S&P Pan Asia REIT Index, it appears there is still a lot of room for rate hikes before their yield spread will vanish.

The posts on this blog are opinions, not advice. Please read our Disclaimers.

Bridging the Volatility Gap between IG and HY

Contributor Image
Hong Xie

Former Senior Director, Global Research & Design

S&P Dow Jones Indices

The goal of the S&P U.S. High Yield Low Volatility Corporate Bond Index is to construct a high-yield bond portfolio with low credit risk and low return volatility by applying a low volatility factor.  Does the index methodology truly deliver the effect of reducing volatility?  The back-tested results of the 17-year period ending Feb. 28, 2017, show that the S&P U.S. High Yield Low Volatility Corporate Bond Index may offer an intersection that bridges the volatility gap between the high-yield and investment-grade bond sectors, with increased return efficiency.

Exhibit 1 shows annualized volatility across the equity and fixed income sectors from Jan. 31, 2000, (the first value date of the index) to Feb. 28, 2017.  As expected, the S&P U.S. High Yield Low Volatility Corporate Bond Index sat between the high-yield and investment-grade bond sectors in the volatility spectrum.

Exhibit 2 illustrates the return/volatility trade-off among various sectors.  The fact that the S&P U.S. High Yield Low Volatility Corporate Bond Index is located above the straight line linking the investment-grade and high-yield bond sectors demonstrates that the index outperforms the return frontier established by the two bond sectors.  This increased return efficiency can also be seen from the S&P U.S. High Yield Low Volatility Corporate Bond Index’s higher ratio of return-to-volatility than that of the broad-based, high-yield index (see Exhibit 3).

The posts on this blog are opinions, not advice. Please read our Disclaimers.

Reading between the lines of China’s “Twin sessions”

Contributor Image
Vania Pang

Capital Markets and Investment Solutions, Index and Quantitative Investment

ICBC Credit Suisse Asset Management (International) Company Limited

China’s National People’s Congress, the annual plenary session of China’s legislature, is done and dusted. No major policy upheaval ahead the 19th Party Congress in November. Nonetheless, the shift in tone in the government work report have shed some light on China’s policy direction.

1. Tone shifted from “maintaining growth” to “containing risk”
The theme of stability, focusing on risk control and deleveraging have been reinforced by Premier Li Keqiang in the government work report. This tone was well set at the Central Economic Work Conference in December 2016.

The economic growth target in 2017 is softened to “6.5% or higher” while both the M2 and total social financing growth target were set at 12% in 2017, 1ppt lower than that of 2016. These targets reflect the government’s intention to contain rising leverage and pursue a prudent monetary policy.

A “neutral and prudent” monetary policy stance is further backed by the recent rate hikes in China together with regulation tightening. Reuters reported PBOC began taking into account off-balance sheet financing to its Macro Prudential Assessment (MPA) at the beginning of 2017. Furthermore, PBOC plans to tighten capital adequacy requirement by removing the “tolerance indicator”, according to sources[1]. The measures would make the expansion of risk assets by commercial banks more costly.

2. Stress on “real economy” and “innovation”
Both President Xi Jinping and Premier Li stressed that the real economy is the foundation for China’s development. The government work report stated that greater efforts will be made this year to upgrade the real economy through innovation.

It is noteworthy that the term “Artificial Intelligence” has been mentioned in the government work report this year, for the first time, saying that AI is one of the emerging industries where development will be accelerated. Many internet companies have been investing heavily on AI. By adopting AI, manufacturing companies could reduce cost and improve efficiency. According to The National Bureau of Statistics, in the first two months of 2017, the investment in high-tech industry grew by 18.4% yoy, or 9.5 ppt higher than the growth rate of total investment.

3. Why a “Total China” approach is the way forward?

Striving a balance between achieving growth target and reducing financial risks would pose both opportunities and challenges to the companies in China. In order to capture the growth story as well as mitigate the risk, a “Total China” approach to index investing should be considered.

The S&P China 500 Index offers a more comprehensive coverage of the top 500 Chinese companies, while approximating the sector composition of the broader Chinese equity market. All Chinese share classes, including A-shares, H shares, US listed ADRs are eligible for inclusion, subject to meeting minimum size and liquidity requirements.

As a result, the S&P China 500 Index offers a more diversified representation across sectors compared to existing major China indices (Figure 1). As of Dec 31, 2016, S&P China 500 has a weight of only 23.6% in the financial sector, much less as compared to FSTE A50 (66.4%), CSI300 (35.48%), and MSCI China (27.04%).  More weights are distributed to new economies such as Information Technology or Consumer Discretionary sectors, offering a more forward-looking representation of China’s economy in the new paradigm where technology-driven consumption plays a significant role.

Historical performance of the diversified S&P China 500 Index has demonstrated better risk-adjusted returns (Figure 2).  During the period from 31-Dec, 2008 to 31-Dec, 2016, the S&P China 500 Index generated an annualized return of 9.6% and a Sharpe ratio of 0.4, both are the highest among the major onshore and offshore China indices.

The S&P China 500’s all-inclusiveness and not biased towards any sector or large SOE mitigates the concentration risks and create a more balanced yet diversified China exposure.

[1] Source: Reuters, 9 March, 2017 http://www.reuters.com/article/china-finance-mpa-idUSL3N1GM2IU

 ————————————————————————————————————————-

DISCLAIMERS
The S&P China 500 Index is a product of S&P Dow Jones Indices LLC and/or its affiliates and has been licensed for use by ICBC Credit Suisse Asset Management (International) Co., Ltd. (ICBCCSI), © 2016 S&P Dow Jones Indices LLC, a division of S&P Global. All rights reserved.  S&P, SPDR and S&P 500 are registered trademarks of Standard & Poor’s Financial Services LLC, a division of S&P Global (“S&P”). DOW JONES is a registered trademark of Dow Jones Trademark Holdings LLC (“Dow Jones”). These trademarks together with others have been licensed to S&P Dow Jones Indices LLC. Redistribution, reproduction and/or photocopying in whole or in part are prohibited without written permission. This document does not constitute an offer of services in jurisdictions where S&P Dow Jones Indices LLC, Dow Jones, S&P or their respective affiliates (collectively “S&P Dow Jones Indices”) do not have the necessary licenses. All information provided by S&P Dow Jones Indices is impersonal and not tailored to the needs of any person, entity or group of persons. S&P Dow Jones Indices receives compensation in connection with licensing its indices to third parties. Past performance of an index is not a guarantee of future results. Neither S&P Dow Jones Indices LLC, Dow Jones, S&P, and their respective affiliates (“S&P Dow Jones Indices”) nor their third party licensors make any representation or warranty, express or implied, as to the ability of any index to accurately represent the asset class or market sector that it purports to represent and neither S&P Dow Jones Indices nor their third party licensors shall have any liability for any errors, omissions, or interruptions of any index or the data included therein.
In this document, ICBC Credit Suisse refers to ICBC Credit Suisse Asset Management Company Limited and its subsidiary, ICBC Credit Suisse Asset Management (International) Company Limited (“ICBCCSI”). ICBCCSI is a regulated entity under the Hong Kong Securities and Futures Commission.
No account has been taken of any person’s investment objectives, financial situation or particular needs when preparing this document. This is not an offer to buy or sell, or a solicitation or incitement of offer to buy or sell, any particular security, strategy, investment product or services nor does this constitute investment advice or recommendation.
The views and opinions expressed in this document, which are subject to change without notice, are those of S&P Dow Jones Indices LLC, ICBC Credit Suisse and/or its affiliated companies at the time of publication. While S&P Dow Jones Indices LLC, ICBC Credit Suisse and/or its affiliated companies (collectively as “we” or “us”) believe that the information is correct at the date of this presentation, no warranty of representation is given to this effect and no responsibility can be accepted by us to any intermediaries or end users for any action taken on the basis of this information. Some of the information contained herein including any expression of opinion or forecast has been obtained from or is based on sources believed by us to be reliable as at the date it is made, but is not guaranteed and we do not warrant nor do we accept liability as to adequacy, accuracy, reliability or completeness of such information.  The information is given on the understanding that any person who acts upon it or otherwise changes his or her position in reliance thereon does so entirely at his or her own risk without liability on our part.
This material has not been reviewed by the Hong Kong Securities and Futures Commission.  Issuer of this material: ICBC Credit Suisse Asset Management (International) Company Limited. This material shall be distributed in countries where it is permitted.
INDEX PERFORMANCE DISCLOSURE
The S&P China 500 was launched on August 28, 2015. All information presented prior to an index’s Launch Date is hypothetical (back-tested), not actual performance. The back-test calculations are based on the same methodology that was in effect on the index Launch Date. Complete index methodology details are available at www.spdji.com. Please read S&P Dow Jones Indices LLC’s DISCLAIMERS.


The posts on this blog are opinions, not advice. Please read our Disclaimers.

Rieger Report: Why foreign investors like U.S. municipal bonds

Contributor Image
J.R. Rieger

Former Head of Fixed Income Indices

S&P Dow Jones Indices

A trend that has been catching attention is purchases of U.S. municipal bonds by foreign investors.  A terrific summary was recently published by VanEck’s Michael Cohick and that can be found by clicking here.

As that research points out, the Federal Reserve data on foreign investor holdings has jumped to end 2016 at $106 billion.  That data can be found on page 125 of the Federal Reserve Statistical Release March 9th 2017.

Some factors that could be making U.S. municipal bonds attractive to foreign investors include:

  • A strong U.S. dollar or perspectives of a strong for longer U.S. dollar.
  • U.S. municipal bonds, whether tax-free or taxable, offer incremental yield relative to the negative or near zero yield environments seen in the Eurozone and Japan.
  • The relatively high quality of investment grade municipal bonds to other asset classes such as U.S. corporate bonds and in some cases sovereign bonds.
  • The low historical default rate of investment grade municipal bonds.
  • Shorter duration than U.S. investment grade corporate bonds.  For example, investment grade municipal bonds tracked in the S&P National AMT-Free Municipal Bond Index have more than a two year shorter duration than those tracked in the S&P 500/MarketAxess Investment Grade Corporate Bond Index. Note: both indices designed to reflect more liquid segments of the markets.
  • Relatively lower volatility of U.S. municipal bonds as compared to U.S. corporate bonds.
  • Due to these factors, U.S. municipal bonds can also be a diversifying asset class.

Liquidity: Due to the large number of U.S. municipal bond issuers and the sheer number of municipal bonds outstanding the depth of liquidity for U.S. municipal bonds has been a factor impacting the market for decades. The lower depth of liquidity for U.S. municipal bonds helps keep yields higher as a liquidity “premium” is demanded by the market in return for this risk. The advent and growth of diversified municipal bond Exchange Traded Funds (ETF’s) could be helping to provide access to and liquidity for municipal bonds. The Federal Reserve Statistical Release shows assets in municipal bond ETF’s have grown from $15.1 billion at year end 2014 to $24.7 billion at year end 2016.

Table:  Select bond indices, their yields and year-to-date returns:

Yield represented is Yield to Worst (YTW). Source: S&P Dow Jones Indices, LLC. Data as of March 24, 2017. Table is provided for illustrative purposes. It is not possible to invest directly in an index. Past performance is no guarantee of future results.

The posts on this blog are opinions, not advice. Please read our Disclaimers.

Rising Rates Arrive

Contributor Image
Fei Mei Chan

Former Director, Core Product Management

S&P Dow Jones Indices

Which of the figures below belong together?


It’s obvious, even if analogies aren’t your strong suit, that A is like C and B is like D.  A and C are not like B and D.

The economic relevance of this simple visual exercise is this: At its March 2017 meeting, the Federal Open Market Committee voted to raise the federal funds rate, the second increase since 2008’s financial crisis. The Fed’s dot plots forecast more increases this year, and of course rising short term rates place pressure on the longer end of the yield curve as well.

Rising interest rates and their impact on equity markets have been a going concern for several years. Intuitively, many investors think that rising interest rates should be bad for the stock market. But recent history has shown that that’s not necessarily the case. From 1991 through 2016, there have been 129 months when the 10-Year Treasury Yield rose. Of these, the S&P 500 gained in 94 of the months and declined in 35—i.e. in a rising rate environment, the market was twice as likely to do well as badly. The common belief that there is an inverse relationship between interest rates and equity market performance is no longer a sure thing.  By extension, the question of rising rates’ impact on factor indices also arises.

This brings us back to our problem in analogies; here’s the same graph we looked at earlier, properly labeled:

For certain strategies that are explicitly risk attenuators or risk amplifiers, the direction of the equity market has much more impact on their relative performance than does the direction of the bond market. For example, the S&P 500 Low Volatility Index tends to outperform in bad markets while lagging in good markets; the S&P 500 High Beta Index (a risk amplifier) exhibits the opposite pattern of returns. As the chart above shows, the average return spreads of Low Volatility were positive in the months when the S&P 500 was down and negative in the months when the S&P 500 was up—and vice versa for High Beta. This dependency on the broader equity market is consistent regardless of the direction of the bond market.

The posts on this blog are opinions, not advice. Please read our Disclaimers.