Get Indexology® Blog updates via email.

In This List

A Sweet Spot in Commodities

Inside The Dow

Lower Oil, Lower Yields

Sukuk 2014 in Review

Ports in the Storm

A Sweet Spot in Commodities

Contributor Image
Jodie Gunzberg

Former Managing Director, Head of U.S. Equities

S&P Dow Jones Indices

It has been a rough start for commodities in 2015 with only six (natural gas, aluminum, lead, sugar, gold and silver) posting gains so far. At our commodities seminar in London last Sept, our speakers agreed picking a winner in this environment is diificult. However, it looks like one of our panelists may have done the job and picked “long sugar” as his best guess.

It is possible he based his guess on fundamentals that indicate rebalancing is often a source of return in commodity investing  where mean reversion works by capturing systematic opportunities.  In 2014, sugar lost 30.9% with a peak to trough drawdown from March through Dec., ending the year with a 1.8% weight in the world-production weighted S&P GSCI.

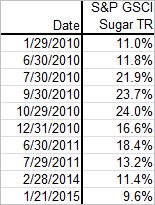
As of the close yesterday, Jan. 21, 2015, sugar’s weight had increased to 2.2% (18.7% growth) with a YTD return of 9.64%. It is the best month for sugar since Feb. 2014 and the last time we saw a January this sweet for sugar was in 2010 when it posted an 11.0% gain.

Source: S&P Dow Jones Indices. Past performance is not an indication of future results.

According to a Reuter’s article, sugar is rising after the Brazilian government restored a fuel tax on gasoline and diesel that is likely to encourage Brazil to produce more ethanol biofuel from sugar. It has also been reported that India is considering higher subsidies for raw sugar exports to cut large stockpiles.

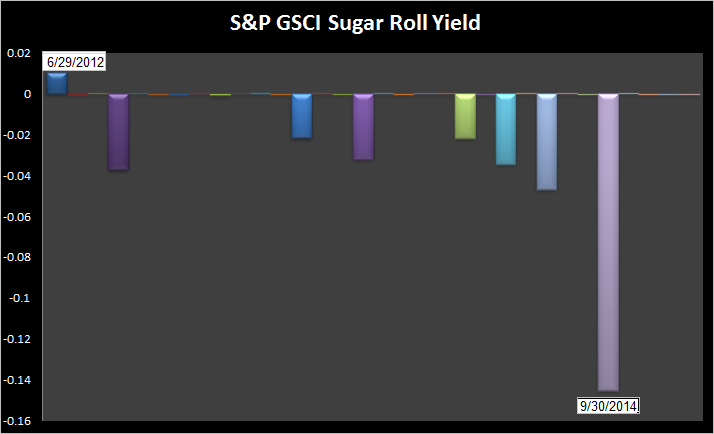
It is possible these interventions may be what sweetens sugar’s term structure given there hasn’t been significant shortages indicated by backwardation (adding more than 1% to the excess return) since June 2012.

Source: S&P Dow Jones Indices. Past performance is not an indication of future results.

The posts on this blog are opinions, not advice. Please read our Disclaimers.

Inside The Dow

Contributor Image
David Blitzer

Former Managing Director and Chairman of the Index Committee

S&P Dow Jones Indices

The Dow Jones Industrial Average is the best-known stock market measure. It has the longest continuous and consistent history of any market average or index and is still going strong today. There is more to the Dow than its long history and the historic record – it is a widely followed guide to the market and a key measure of large blue chip companies in the United States. It is on web sites and television news and is carried every day in the Wall Street Journal and many other newspapers. The Dow was created by the editors of the Wall Street Journal in 1896, a few years after the Journal itself began publishing. Today it is maintained and calculated by S&P Dow Jones Indices and overseen by the Averages Committee; both S&P Dow Jones Indices and the Wall Street Journal are represented on the committee.

The Dow and the S&P 500 both chronicle the US market and tell similar stories. The chart shows the two indices from April, 1957 to December 2014.  The figure starts in 1957 because that is when the S&P 500, a comparative newcomer, expanded from 90 to 500 stocks. The Dow has been 30 stocks since 1928; it began with 12 stocks in 1896.  The correlation of monthly returns is 95.4%, confirming the close tracking. In the 692 months from May 1957 to December 2014, the two indices rose, or fell, together in 627 months. The close tracking should not be a surprise. The overall stock market often reacts to large shifts in the economy or changes in Fed policy.  Moreover, the 30 stocks in the Dow account for slightly more than one-quarter of the S&P 500’s $19 trillion dollar market value.

Despite the close tracking between the Dow and the S&P 500, the calculation method is different. The Dow is a price weighted index; the calculation is simple enough to do with a pencil and paper in a few minutes. To calculate the Dow, add up the price of each stock and divide by the divisor, currently about 0.155. The divisor is adjusted whenever a stock is added or dropped to prevent the index from jumping or falling when the market didn’t. Corporate actions that affect a stock price, such as a stock split, also lead to a divisor change. The easiest way to think about the Dow is a portfolio which holds one share of each of the 30 stocks.  The importance of a stock depends on its price, not on the stock’s total market value. While some argue that this is the wrong way to measure the market, it may actually be close to the way many investors think of their own portfolios. Rarely do investors owning individual stocks try to make their relative size of their holdings track the market capitalization proportions of the companies they own. More often they try to hold either equal dollar amounts or equal numbers of shares in various companies.

Source: www.DJAverages.com, S&P Dow Jones Indices.

Next: Arguing that Apple and Google should be in the Dow, but don’t fit.

The posts on this blog are opinions, not advice. Please read our Disclaimers.

Lower Oil, Lower Yields

Contributor Image
Kevin Horan

Former Director, Fixed Income Indices

S&P Dow Jones Indices

The unprecedented drop in oil prices has been a driver of global economic worries.  As of Jan. 16, 2015, the total return of the S&P GSCI Crude Oil is down 8.89% MTD, after closing out 2014 down 42.5%.

As of the same date, the S&P U.S. Issued Investment Grade Corporate Bond Index has returned 1.76% MTD, as the energy sector accounts for only 8% of market value for this index.  In comparison, the energy sector of the S&P U.S. Issued High Yield Corporate Bond Index has returned 14% MTD and reached 17.6% in October 2014.

The S&P U.S. Issued High Yield Corporate Bond Index has returned 0.08% MTD as of Jan. 16, 2015, but the index would be returning 0.32% without its energy sector.  In regard to credit ratings and issuers, this index is similar to the S&P/LSTA U.S. Leveraged Loan 100 Index, which has returned 0.16% MTD.

The yield on the U.S. 10-year Treasury bond, as measured by the S&P/BGCantor Current 10 Year U.S. Treasury Index, tightened by 13 bps to close at 1.83% on Jan. 16, 2015.  This closing rate, before the U.S. holiday on Monday, was in stark contrast to the prior day’s yield of 1.74%.  To match a 1.74% yield on the U.S. 10-year Treasury bond, we would have to look all the way back to May 2013.

Recently, the U.S. 10-year Treasury bond has been trading at 1.76%, as the market speculates that the European Central Bank (ECB) will start buying more bonds as part of its stimulus package.  Relative to European bonds, yields in the U.S. look attractive for European investors, as their domestic yields have been reaching record lows.  The yield of a German 10-year treasury bond is approximately 0.44% at this time, while the forex quote on U.S. dollar-to-euro rate is USD 1.156.  The currency exchange, which had dropped from USD 1.39 in March 2014 to a year-end value of USD 1.209, has continued its trend as the U.S. dollar continues to strengthen.

Exhibit 1: S&P/BGCantor Current 10 Year U.S. Treasury Index Yield-to-Worst
S&P BGCantor Current 10 Year U.S. Treasury Bond Index YTW Chart


Source: S&P Dow Jones Indices LLC.  Yield-to-worst levels as of Jan. 16, 2015.  Charts and tables are provided for illustrative purposes only.  Past performance is no guarantee of future results.

The posts on this blog are opinions, not advice. Please read our Disclaimers.

Sukuk 2014 in Review

Contributor Image
Michele Leung

Former Director, Fixed Income Indices

S&P Dow Jones Indices

The Dow Jones Sukuk Total Return Index (Ex- Reinvestment) delivered a total return of 6.37% in 2014, which outperformed its 0.23% gain in the prior year; see Exhibit 1 for the index performance.

Exhibit 1: Total Return Performance of the Dow Jones Sukuk Total Return Index (Ex-Reinvestment)

Source: S&P Dow Jones Indices. Data as of December 31, 2014.  Charts are provided for illustrative purposes.
Source: S&P Dow Jones Indices. Data as of December 31, 2014. Charts are provided for illustrative purposes.

With the continued growth in the sukuk market, the total market value tracked by the index rose 32% to USD 48 billion, as of December 31, 2014.  Comparing the new issues in 2013 and 2014, both the count and the size grew; the average sukuk deal size reached 880k, see Exhibit 2 for the comparison.

Exhibit 2: New Issues Comparison

2013

2014

Total  Count

13

16

Total Par Amount

   10,800,000,000

          14,100,000,000

Total Market Value

   10,714,815,969

          14,655,559,089

Average Deal Size

830,769,231

                881,250,000

Source: S&P Dow Jones Indices. Data as of December 31, 2014.  Charts are provided for illustrative purposes.

Looking at the new issues in 2014, the biggest sukuk issuer was IDB Trust, totaling 3 billion, followed by Saudi Electric, totaling 2.5 billion.  There were new entrants in the sovereign sukuk space, such as South Africa (issued 500mio) and Hong Kong (issued 1 billion), and the returning issuer Indonesia (issued 1.5 billion).

The posts on this blog are opinions, not advice. Please read our Disclaimers.

Ports in the Storm

Contributor Image
Craig Lazzara

Former Managing Director, Index Investment Strategy

S&P Dow Jones Indices

Since last fall, the S&P 500 has gone through three distinct downdrafts.  Between September 18 and October 15, the index fell by 7.3%.   It recovered that lost ground, and then some, rising

500 18_Sept_14 to 14_Jan_15

11.8% through December 5.  Then a second, less severe, decline began, as the index fell 4.9% between December 5 and December 16, followed by a 6.0% recovery through December 29.  This brought the S&P 500 to its (so far!) all-time high.  From December 29 through yesterday’s close, the index is down an additional 3.7%.  Patterns in the S&P MidCap 400 and S&P SmallCap 600 Indices have been very similar to those in the 500.

The net of these gyrations is a total return of 0.6% in the 82 days since September 18, but with heightened volatility; the standard deviation of daily returns for the S&P 500 was 14.5%.  In the 82 days prior to September 18, the standard deviation of daily returns was only 8.0%.  So we have just come through a period that is relatively directionless but quite choppy; investors who are preoccupied by the chop may not even notice that their total returns are still positive.

One of the notable things about directionless, choppy markets is that defensive strategies tend to do surprisingly well.  The S&P 500 Low Volatility Index, e.g., rose by 8.7% since September 18 — mitigating the three periods of decline, while lagging the S&P 500 during its rebounds.  This pattern of protection in down markets and participation in up markets is typical of low volatility strategies, and seems to occur on a global basis.   The low volatility flavors of the S&P 400 and S&P 600 also provided protection in the recent down periods and participation in the up moves.  It’s not perfect protection, obviously, and it’s not full participation, but the record shows that all three low vol indices performed as we would have expected.

Low vol vs. vanillas

We’re dealing with only four months of data, of course, and past performance is never a guarantee of future results.  And it’s fair to say that low vol strategies have historically lagged in a strong market advance.  But for investors who want equity exposure, would prefer a smoother ride, and are willing to underperform in a strong market — low volatility strategies may offer a comfortable port in the storm.


The posts on this blog are opinions, not advice. Please read our Disclaimers.