Get Indexology® Blog updates via email.

In This List

Right Conclusion (maybe), Wrong Reason (definitely)

Retail Sales Hop Before the Easter Weekend

Introduction to Preferred Shares in Canada

S&P 5-YEAR DIVIDEND SNAPSHOT (and know when your paycheck comes in)

U.S. Domestic Dividends Set Record Increases

Right Conclusion (maybe), Wrong Reason (definitely)

Contributor Image
Craig Lazzara

Former Managing Director, Index Investment Strategy

S&P Dow Jones Indices

This morning’s Wall Street Journal joined (actually, re-enlisted in) the chorus of those arguing that 2014 would be a time for stock pickers to “shine.”  The lynchpin of the Journal‘s case will be familiar to advocates of a “stock-picker’s market.”  That argument is that since correlations in the U.S. equity market are declining (perhaps as a consequence of the Federal Reserve tapering its support of the Treasury market), stock selection strategies will perform better than in a more macro-driven investment environment.

That conclusion may turn out to be correct — we’ll know in less than a year’s time.  But it won’t be correct for the reason the Journal, and so many others, typically cite.

Correlation is largely a measure of timing — it tells us whether two assets tend to go up and down at the same time.  Here’s a simple illustration:

A and B
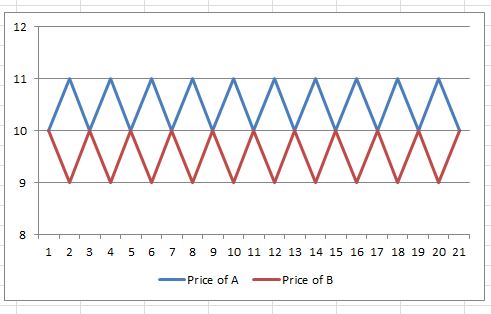
Stock A and stock B are perfectly negatively correlated — whenever one goes up, the other goes down.  But their returns are identical.  An omniscient day trader would benefit hugely from their negative correlation.  For a stock picker with a longer time horizon, it doesn’t matter — his return is the same regardless of which stock he picks.  Despite the negative correlation, that doesn’t strike us as a good environment for stock picking.

Dispersion gives us a better measure of the potential opportunity for stock pickers.  Unlike correlation, which is a measure of timing, dispersion is a measure of magnitude — specifically, of the extent to which the return of the average stock differs from the market average.  In a high dispersion environment, there’s a relatively large gap between the “best” and the “worst” stocks; when dispersion is low, the gap is small.  We can think of dispersion as a measure of the value of successful stock selection:

Dispersion and active manager performance_2013
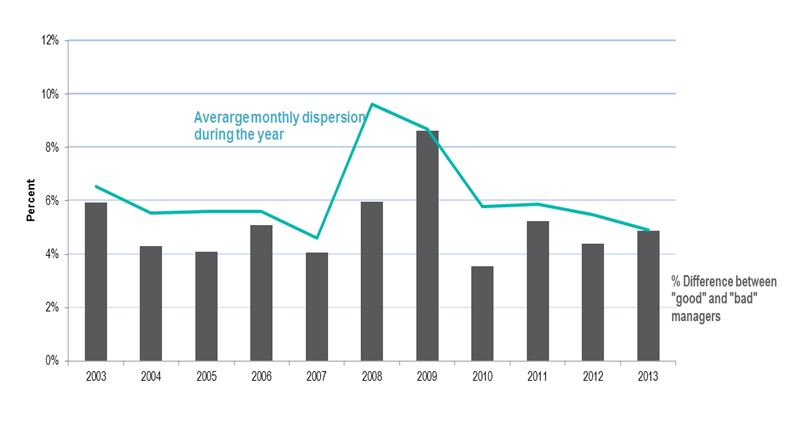
The line in the graph above represents the average dispersion for the calendar year in question; the bars represent the interquartile range (i.e. the 25th percentile minus the 75th percentile) of large cap core equity managers in our year-end SPIVA survey.  The relationship isn’t perfect, but it’s certainly true that the gap between better- and worse-performing managers tends to be greater when dispersion is higher.

And so what does dispersion tell us?  Dispersion in calendar 2013 was lower than for any year since 1991.  Recently, though, dispersion has begun to climb.  At the end of March, S&P 500 dispersion stood at 4.90%.  For the 30 days ended April 14th, dispersion had risen to 5.9%.  This reading is still below average by historical standards, but well above the lows of 2013.  If dispersion continues to trend upward, that could make 2014 a “stock-picker’s market.”  And if 2014 is a “stock-picker’s market,” it will be because dispersion increased, not because correlation fell.

The posts on this blog are opinions, not advice. Please read our Disclaimers.

Retail Sales Hop Before the Easter Weekend

Contributor Image
Kevin Horan

Former Director, Fixed Income Indices

S&P Dow Jones Indices

Treasuries closed the week returning 1.02% as measured by the S&P/BGCantor Current 10 Year U.S. Treasury Bond Index.  Last week’s return was the strongest weekly return since the flight to safety trade driven by Ukraine / Russia news from the week of March 14th, which remains the largest weekly gain for the year.

This week started with a hop in Retail Sales, as reported numbers were stronger than expected and are at levels that have not been seen since September, 2012.  Treasuries sold off moving the 10-year yield to a 2.64%, up from its Friday close of 2.62%.  Tomorrow’s March CPI number (0.1% expected) along with Housing Starts (975K expected), Jobless (315k expected) and the end of the week Philadelphia Fed Outlook, all have the potential to move the indices.

Away from domestic economic measures, $18 billion of the 5-year TIPS will be auctioned by the Treasury on the 17th.  The week has the potential to be quiet heading into the Easter Holiday, though global politics and the evolving Ukraine situation can affect the directions of markets at any time.

This week’s new issuance in investment grade debt continues at a healthy pace, the majority of new paper focuses around 3 and 5-year maturities, but there were some longer maturity deals such as $500 million Gerdau 7.25% 30-years.  The S&P U.S. Issued Investment Grade Corporate Bond Index returned 0.8% for the week and is just under about 1% (0.98%) for the month.  Year-to-date investment grade corporates are returning 3.90%.

The S&P U.S. Issued High Yield Corporate Bond Index is returning 0.23% for the month while year-to-date peaking at a 3.34% before dropping slightly to close the week at 3.2% YTD.  A number of ratings changes occurred through-out the week as rating agencies evaluate credit valuations.  One such familiar issuer was Alcoa who rating was cut from BBB- to BB+ by Fitch on the 11th.  These bonds are already in the S&P U.S. Issued High Yield Corporate Bond Index because of their Moody’s rating of Ba1 and account for less than 1% of the index’s market value.

The pace of loan issuance slowed up a little this past week as issuers dealt with existing calendar deals that have been in the works.  The digestion of recent aggressively structured and priced deals has the S&P/LSTA U.S. Leveraged Loan 100 Index giving up ground for the week returning -0.10%.  Month-to-date this index is down -0.3% and the yearly return has hovered just at or under 1% since the middle of March.


Source: S&P Dow Jones Indices, Data as of 4/11/2014, Leveraged Loan data as of 4/13/2014.

The posts on this blog are opinions, not advice. Please read our Disclaimers.

Introduction to Preferred Shares in Canada

Contributor Image
Phillip Brzenk

Managing Director, Global Head of Multi-Asset Indices

S&P Dow Jones Indices

What are Preferreds?
Preferred shares are hybrid equity securities, with characteristics that lie between the traditional fixed income and equity asset classes.  Like common shares, preferred shares represent ownership in a company and are listed as equity on the balance sheet; the ownership isn’t entirely the same though.  Preferreds have preferential rights to dividend payments before common shares, which is thanks to their seniority in the capital structure.  On the other hand, common shares come with the right to vote on corporate matters, a feature that preferreds lack.

Several characteristics that preferreds share with bonds are that they are issued at a fixed par value and dividend payments are a fixed percentage rate of par. Independent credit rating agencies, such as DBRS and S&P Ratings Services, rate preferred securities using the same guidelines as bonds.  Preferreds offer less security to investors than bonds, as they sit lower in the capital structure and issuers have more flexibility in cancelling or postponing a dividend payment if it is running into liquidity issues.

A main benefit of preferreds is that they pay sizable dividends, with most paying a fixed amount on a quarterly basis.  In fact, when looking at the asset class yields of bonds, preferreds and common equity, one can see that preferreds offer the highest yields.

Preferreds 1

Preferred Market Overview
With interest rates continuing to remain at historic lows, investors have been looking for investments that offer higher yields than common stocks and bonds.  Since preferreds meet this condition and have shown relatively low price volatility, the asset class has been a benefactor of investor demand.  The preferred market in Canada grew to an estimated CAD 61.5 billion at the end of the year in 2013, doubling in size since year-end 2008.  The exhibit below shows the growth of the Canadian preferred market over the past five years.

Preferreds 2

The posts on this blog are opinions, not advice. Please read our Disclaimers.

S&P 5-YEAR DIVIDEND SNAPSHOT (and know when your paycheck comes in)

Contributor Image
Howard Silverblatt

Senior Index Analyst, Product Management

S&P Dow Jones Indices

March marked the fifth anniversary from the Bear market low. Dividends have not only recovered from their bottom, but are setting new records. Yields are less, but relative to other instruments they remain competitive, and have a much lower tax rate. Two observations that became apparent are the risk-reward trade off and the yields. For the S&P indices, the large-cap market has more issues which pay a dividend and more issues which increase year-after-year. On a risk-reward note, the S&P 500 offers a higher yield, with a richer history of increases. However, that security of income comes at the cost of capital appreciation, with the S&P Small and Mid caps having returned more in stock price (and total return).

pic3

pic6

The posts on this blog are opinions, not advice. Please read our Disclaimers.

U.S. Domestic Dividends Set Record Increases

Contributor Image
Howard Silverblatt

Senior Index Analyst, Product Management

S&P Dow Jones Indices

Data is for U.S. Domestic Common Stock, not just the S&P 500
U.S. domestic common issues set a first quarter record for dividend increases, as the ‘shareholder’ return theme continued. Increases have been made easier by record earnings and record cash holdings. Additionally, many issues (especially large-caps) have heard the knocking at the boardroom door – from activists. I expect strong dividend growth to continue in 2014, as ‘shareholder return’ continues to be the battle cry from boardrooms, and those knocking at the boardroom door. I expect the actual cash payments for 2014 to post a double-digit increase over the record setting 2013 level. Yields remain competitive, with qualified dividends have a tax advantage.

For U.S. domestic common stock in Q1 2014:
U.S. domestic common issues set a first quarter record for dividend increases, as the ‘shareholder’ return theme continued.

Record number of increases (increases, extras, initiations, resumptions), as 1,078 issues increase, surpassing the record of 1,069 set in 1979 (records start in 1955) 102 issues decrease (decrease, suspend), verses 139 in Q1,’13

Q1,’14 indicated dividend rate increases $17.8 billion, a 22.9% rise over the Q1,’13 $14.5 billion gain 12 month March 2014 increases $60.0 billion verses 2013’s $56.7 billion

The percentage of dividend paying issues (U.S. domestic common, ASE, NYSE, NASD) decreased to 47.0% from Q4,’13’s 47.7% (Q3,’13’s 47.4%, Q2,’13’s 47.3%, but up from Q1,’13’s 46.1%)
The number of payers went up, but the number of trading issues went up much more 84.2% of the S&P 500 (421 issues) pay a cash dividend, the most since Sep,’98 (was 473 when I started in May,’77), and all of the DJIA30 issues pay

Yields slightly increased, as the market’s growth slowed (but there was price appreciation) Weighted dividend yield at the end of Q1,’14 was 2.48%, compared to 2.44% for Q4,’13, and Q1,’13 was 2.61%

Dividend yields remain relatively attractive compared to other instruments such as corporate bonds, treasuries, and bank CDs, especially considering the lower (permanent) tax rate advantage.

Payout rates (dividends as a percentage of As Reported GAAP earnings) remain low, as companies payout record amounts, but payout less as a percentage of what they are making -> cash sets another record

U.S. common stocks set a Q1 record (from 1955) for increases, beating out 1979 (fyi: 10-year is 2.68%, was 10.33% in ’79 and then went up to 15.8%; 500 yield is 1.9% and was 5.2%)
pic1

pic2

The posts on this blog are opinions, not advice. Please read our Disclaimers.