Get Indexology® Blog updates via email.

In This List

Will the Super Bowl Theory Hold Up This Time?

COMMODITY ZODIAC: Prosperous Horse

Housing Finance: Déjà vu All Over Again

The Shrinking US Federal Budget Deficit

S&P Dow Jones Indices CEO, Alex Matturri, Speaks to Bloomberg TV on Asia Business Outlook

Will the Super Bowl Theory Hold Up This Time?

Contributor Image
Howard Silverblatt

Senior Index Analyst, Product Management

S&P Dow Jones Indices

Every once and a while there are some events which are totally irrational, but they happen. You toss a coin in the air and it comes up heads five times in a row.  The chances of it being heads on the next toss is still 50% – but five in a row. In the market we have a few strange items as well; statements which do not follow logic or analytical analysis.  Two for January are below.

SUPER BOWL THEORY IS CORRECT 37 OF THE 47 YEARS
Quarterbacked by Howard Silverblatt, with special teams player David Silverblatt

The Super Bowl Predictor Theory says that the market will gain for the year if an NFC (National Football Conference) team or an AFC (American Football Conference) team with an NFC origin wins the game, otherwise the market will fall – totally irrelevant items to the market. However, the indicator has been correct 37 of the last 47 years, or 78.7% of the time, on a total return basis for the S&P 500. On a stock appreciation basis, 2011 (which lost 0.003% but gained 2.11% on a total return basis), and 1994 (which lost 1.54% and gained 1.32% on total return basis) couldn’t be counted; meaning the count would be 35 of 47, or 74.5%. Either way, 78.7% on a total return basis or 74.5% for stock alone, it is a much better track record than most stock pickers. This year’s game sets the NFC Seattle Seahawks against the AFC Denver Broncos. If Seattle wins the theory says that the S&P 500 will be up this year; if Denver wins the theory says that the market closes down.

AS GOES JANUARY, SO GOES THE YEAR
‘As goes January, so goes the year’ is an old Wall Street saying. What makes the saying irrational is that January is only one of twelve months, and that there is no rational reason to draw such a conclusion. However, the problem is ‘As January goes, so goes the year’ has been right for 62 of the last 85 years, or 72.9% of the time: 51.8% of the time January and the market moved up together and 21.2% of the time they move down together. January has been up 55 times since 1929, with that year being up 44 times, or 80% of the time. The market closed down 30 times in January over that time period, with the year being up 12 times, or 40% of the time. This January the market was down 3.56%, and down 3.46% with dividends – root for Seattle.

———————————–

Please note that the statistical data is based on publicly available information, most of which is available in S&P products such as Capital IQ, Compustat Research Insight and S&P Index Alert.  Analysis and projections are my own, and may differ from others within S&P/McGraw Hill.  Nothing presented is intended to, or should be interpreted as, a buy/sell/hold recommendation.
My notes vary in topics, but are market related. The intent is to quickly inform. The assumption is that you don’t need a basic education, editorial or sales pitch, just specific facts and maybe some observations. If the information does not suit your needs, please e-mail me and I will take you off the list. Unless otherwise noted all data is for public dissemination, and may not be used for commercial purposes.  Finally, any incoming correspondence from you will be considered confidential unless you specify otherwise.
DISCLAIMER
The analyses and projections discussed within are impersonal and are not tailored to the needs of any person, entity or group of persons.  Nothing presented herein is intended to, or should be interpreted as investment advice or as a recommendation by Standard & Poor’s or its affiliates to buy, sell, or hold any security.  This document does not constitute an offer of services in jurisdictions where Standard & Poor’s or its affiliates do not have the necessary licenses. Closing prices for S&P US benchmark indices are calculated by S&P Dow Jones Indices based on the closing price of the individual constituents of the Index as set by their primary exchange (i.e., NYSE, NASDAQ, NYSE AMEX).  Closing prices are received by S&P Dow Jones Indices from one of its vendors and verified by comparing them with prices from an alternative vendor. The vendors receive the closing price from the primary exchanges.  Real-time intraday prices are calculated similarly without a second verification.   It is not possible to invest directly in an index.  Exposure to an asset class is available through investable instruments based on an index.  Standard & Poor’s and its affiliates do not sponsor, endorse, sell or promote any investment fund or other vehicle that is offered by third parties and that seeks to provide an investment return based on the returns of any S&P Index.  There is no assurance that investment products based on the index will accurately track index performance or provide positive investment returns.  Neither S&P, any of its affiliates, or Howard Silverblatt guarantee the accuracy, completeness, timeliness or availability of any of the content provided herein, and none of these parties are responsible for any errors or omissions, regardless of the cause, for the results obtained from the use of the content.  All content is provided on an “as is” basis, and all parties disclaim any express or implied warranties associated with this information.  The notes and topics discussed herein are intended to quickly inform and are only provided upon request.  If you no longer wish to receive this information or if you feel that the information does not suit your needs, please send an email to Howard.silverblatt@spdji.com  and you will be removed from the distribution list.  A decision to invest in any such investment fund or other vehicle should not be made in reliance on any of the statements set forth in this document.  Standard & Poor’s receives compensation in connection with licensing its indices to third parties.  Any returns or performance provided within are for illustrative purposes only and do not demonstrate actual performance.  Past performance is not a guarantee of future investment results.  STANDARD & POOR’S, S&P, and S&P Dow Jones Indices are registered trademarks of Standard & Poor’s Financial Services LLC.

The posts on this blog are opinions, not advice. Please read our Disclaimers.

COMMODITY ZODIAC: Prosperous Horse

Contributor Image
Jodie Gunzberg

Former Managing Director, Head of U.S. Equities

S&P Dow Jones Indices

Happy Chinese New Year for all celebrating!  As a special tribute, this post will focus on the fact that all 5 commodities that start with the letter “c” (the same letter China starts with) in the S&P GSCI Agriculture and Livestock have had positive returns in 2014.  I picked the agriculture and livestock to symbolize the importance of food for the year.  Further to honor the new year, I will specifically highlight how China has influenced each of these commodities.

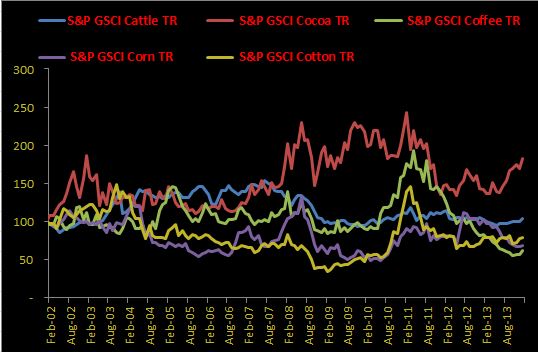
Let’s start with a general cumulative performance chart (and notice the special celebration colors of red and gold for extra luck!) of each of the commodities that start with the letter “C” that are in the agriculture and livestock sector.  Based on monthly returns from 2002, the last year of the horse, cocoa and cattle (two of my favorite commodities) performed well, returning 82.7% and 3.6%, respectively.  Unfortunately, coffee, corn and cotton were less fortunate and lost 38.5, 31.2 and 21.2%, respectively.

Source: S&P Dow Jones Indices. Data from Feb 2002 to Jan 2014. Past performance is not an indication of future results. This chart reflects hypothetical historical performance. Please see the Performance Disclosure at the end of this document for more information regarding the inherent limitations associated with backtested performance.

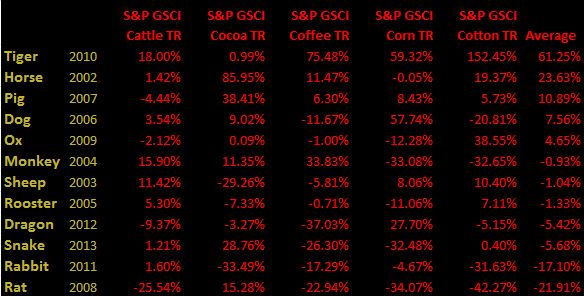
Under which signs were food commodities that start with “c” most successful?  The last year of the horse did very well, returning on average 26.3% with a stellar cocoa performance of 86%.  In fact, the only sign that had better average performance was the TIger. (That’s my sign so is probably why I’m a commodity lady!) Check out the table below to see performance in the last cycle by sign:

Source: S&P Dow Jones Indices. Data from Feb 2002 to Jan 2014. Past performance is not an indication of future results. This chart reflects hypothetical historical performance. Please see the Performance Disclosure at the end of this document for more information regarding the inherent limitations associated with backtested performance. Also please note the years in the table are not exact calendar years but coincide with the Chinese calendar months.

Hopefully the year of the horse will be prosperous again and bring happiness and health.  Given Chinese demand growth is one of the major influences on commodities, I thought it would be appropriate to touch on how China affects each of these commodities.

Coffee: Coffee is up 8.4% YTD; Consumption of coffee in China is expected to grow by an annual rate of 9% for the next five years. This is not only from China’s large population but it’s rising middle class, which is expected to grow to 630 million people from 230 million.  Additionally, dry weather in Brazil has supported coffee returns this year. In the past 30 days, rain was as much as 50 percent below average, according to a US based weather group.

Cocoa: Cocoa is up 7.5% YTD; Although the average Chinese consumer only consumes one chocolate bar per year, which is relatively low compared to the 11 bars per year consumed by the average Japanese consumer and 82 bars per year by German consumers. (And 365 bars per year by me.) However, according to KPMG, China’s chocolate sales have increased 40% from 2009 to 2012. As the middle class continues to grow and demand higher quality chocolate, the supply shortage of cocoa butter continues to persist, driving up the price of cocoa.  For a deeper analysis on cocoa, please see this prior post.

Cattle: Cattle is up 3.6% YTDAccording to the National Development and Reform Commission (NDRC), per capita beef consumption in China will increase 0.32kg to 5.19kg per year between 2011 and 2015. This is mainly for the same reasons as the increase in demand for coffee and cocoa, which are from the rise in the middle class of China.  As incomes grow, the people like to try new things that may have been unattainable before the new-found wealth. Further supporting the price of beef is the supply shortages that are occurring for various reasons like weather.

Corn: Corn is up 2.7% YTD; however, most of the upside has come from weather shocks in Brazil that is increasing the crop stress for corn, though may be more favorable for soybeans. Also, U.S. sales have increased despite the big news from China of the ban on the GMO variety of corn.  According to a report by Xinhua, China has rejected 601,000 metric tons of US corn, containing the unapproved genetically modified MIR 162 substance.

Cotton: Cotton is up 1.6% YTD; China has a major influence on the cotton price.  Most of the question about how price will be impacted comes from the stockpiling situation by the Chinese government.  They have announced the stockpiling program will end, which may be bearish, though it is possible production could be cut based on this news, which would possibly be bullish. China’s Cotton Association predicts 2014 China cotton production will fall 5%-10% as cotton planting drops 9% this year to 9.9 million acres after farmers cut cotton plantings in favor of more profitable crops.


The posts on this blog are opinions, not advice. Please read our Disclaimers.

Housing Finance: Déjà vu All Over Again

Contributor Image
David Blitzer

Former Managing Director and Chairman of the Index Committee

S&P Dow Jones Indices

Bonds May Puzzle But Stocks Could be Worrisome

Bonds: Just when people thought we were safe from creative financing applied to bonds backed by homes, a new improved approach is about to surface.  The past year has seen an increase in buying homes for rent by private equity funds and others.  The private equity buyers are funded by their fund investors, much the same way private equity investments in corporate businesses are funded.  As noted in the New York Times yesterday, American Homes 4 Rent, a publicly traded real estate investment trust is planning a bond issue to raise funds to purchase homes for rent. The company went public last summer and has a market value of about $3 billion.   If this bond issue proves successful, and is followed by further issues from other companies looking to enter the home purchase-to-rent business, this could accelerate a shift towards renting from buying.

The growth in buy-to-rent may raise some risks to the economy.  If a large buy-to-rent firm fell on hard times or if housing prices in an area with significant rental activity were to drop, the owner of rental homes might be tempted to dump the houses on the market putting huge downward pressure on prices, and the local economy.  Such a move might mean falling prices and the specter of default for rent-to-buy bonds.  At present the extent of rent-to-buy is modest and the risk of a major economic reversal from a collapse in the rental housing market is limited. Separately the Census Bureau reported today that the home ownership rate for the fourth quarter of 2013 was 65.2%, a bit below the figure of 65.4% at the end of 2012.

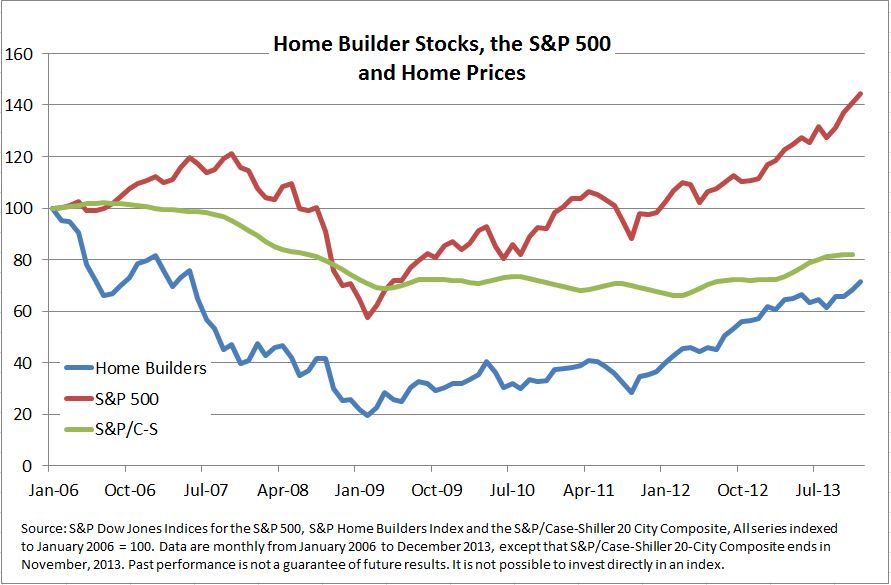
Stocks: While housing starts and new home sales lagged in this long drawn out recovery, home building stocks did well.  Home builders, as shown by the S&P Home Builders Index, dropped farther and faster than either home prices or the S&P 500. (see chart). The exciting part started at the bottom in February 2009 – well before home prices turned up in the second quarter of 2012.  From the bottom, the home builders are up about 2.6 times, much better than the 1.5 times gain in the S&P 500. Home prices are above their level of February 2009, but not by much.

The recent activity is not as nice. From December 31st 2013 to the end of January 2014, home builders are down 5.1% compared to a drop of 3.5% for the S&P 500.

The posts on this blog are opinions, not advice. Please read our Disclaimers.

The Shrinking US Federal Budget Deficit

Contributor Image
Bluford Putnam

Managing Director and Chief Economist

CME Group

The US federal budget has a reasonable probability (our base case scenario) of reaching operational balance – revenues equal expenses excluding interest expense – by FY2015. This is an amazing turnaround and it means that budget deficit is now shrinking faster, meaning reduced supply of US Treasuries, even as the Federal Reserve tapers its quantitative easing program, rendering any net impact on the bond market from QE-tapering as moot. Let’s put this shrinking deficit into perspective.

The US federal budget deficit surged to just over 9% of GDP or about $1.4 trillion in FY2009, including interest expense. The messy bankruptcy of Lehman Brothers and the bailout of AIG September 2008 had spooked financial markets. Under President Bush, then-Treasury Secretary Paulson had gone to the US Congress for a trillion dollars of emergency spending. As this money was disbursed, the budget deficit ballooned. For some analysts, given the depth of the recession and huge job losses, it seemed that it could take a decade or more to return to fiscal stability. That negative analysis could not have been more wrong.

The US economy has been growing in real GDP terms since late 2009. And despite losing over 850,000 jobs in the government sector, private job growth has been quite strong since 2010. Corporate profits have had a very robust recovery over the last several years, and the consumer has become more confident. So despite government retrenchment at all levels – federal, state, and local – the private sector has fueled surging government tax revenues. Inflows to the US Treasury were up 8% in FY2013 compared to FY2012, for example.

If the US economy can post growth above 3% in real GDP terms in 2014, as we think it can (see “US Economy: Solid Momentum Entering 2014” at www.cmegroup.com/putnam), then tax revenues are likely to continue to grow at a healthy pace. In the meantime, a divided US Congress and no major new spending legislation have meant that federal government expenditure growth has been virtually non-existent for the last few years. This is a powerful combination – robust tax revenue growth and flat expenditures – for deficit reduction. Our base case scenario is for about a federal budget deficit in FY2015 of 1.5% of GDP, and since interest expense is likely to be in the 1.5% to 2% range, this translates into a balanced operational budget. The Congress Budget Office is not as optimistic, but one can expect revisions in their long-term projections should the economy stay as healthy as we hope.

For all this short-term good news, of course, the longer-term challenges to the US federal budget coming from an aging population and a much slower growing labor force should not be minimized. Nevertheless, for those market participants trying to analyze what a the Fed QE-taper might do to bond yields, it is an interesting counterpoint to recognize that US Treasury supply is actually shrinking faster than the Fed is reducing its purchases.

US Federal Government Revenues and Outlays

S&P Dow Jones Indices is an independent third party provider of investable indices.  We do not sponsor, endorse, sell or promote any investment fund or other vehicle that is offered by third parties. The views and opinions of any third party contributor are his/her own and may not necessarily represent the views or opinions of S&P Dow Jones Indices or any of its affiliates.

The posts on this blog are opinions, not advice. Please read our Disclaimers.

S&P Dow Jones Indices CEO, Alex Matturri, Speaks to Bloomberg TV on Asia Business Outlook

Contributor Image
Dave Guarino

Director, Global Index Communications

S&P Dow Jones Indices

S&P Dow Jones Indices CEO, Alex Matturri, sits down with Bloomberg TV in Hong Kong to discuss SPDJI’s business objectives in Asia-Pacific for 2014.

The posts on this blog are opinions, not advice. Please read our Disclaimers.