Get Indexology® Blog updates via email.

In This List

Misplaced Fears and Real Worries

A Review of the Financial Markets in 2013

What's Shocking About Commodities In 2014?

Two Dimensions of Risk

Facebook Selling Into the S&P 500

Misplaced Fears and Real Worries

Contributor Image
David Blitzer

Former Managing Director and Chairman of the Index Committee

S&P Dow Jones Indices

Data are annual 1948 to 2013. Data for 2013 are based on 11 months excluding December. Source is the St. Louis Federal Reserve Bank

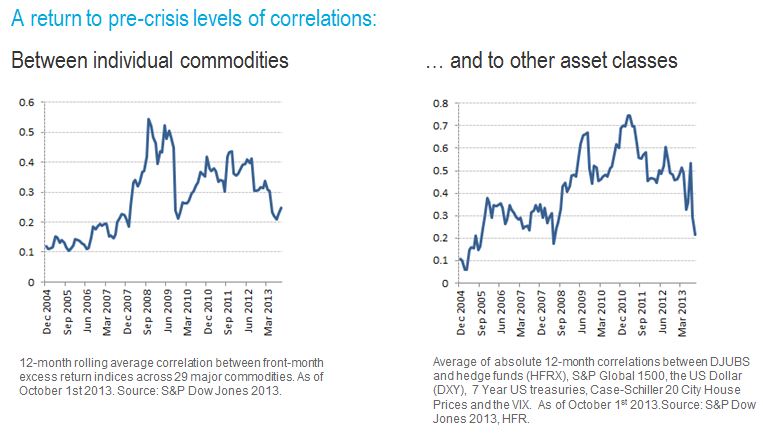
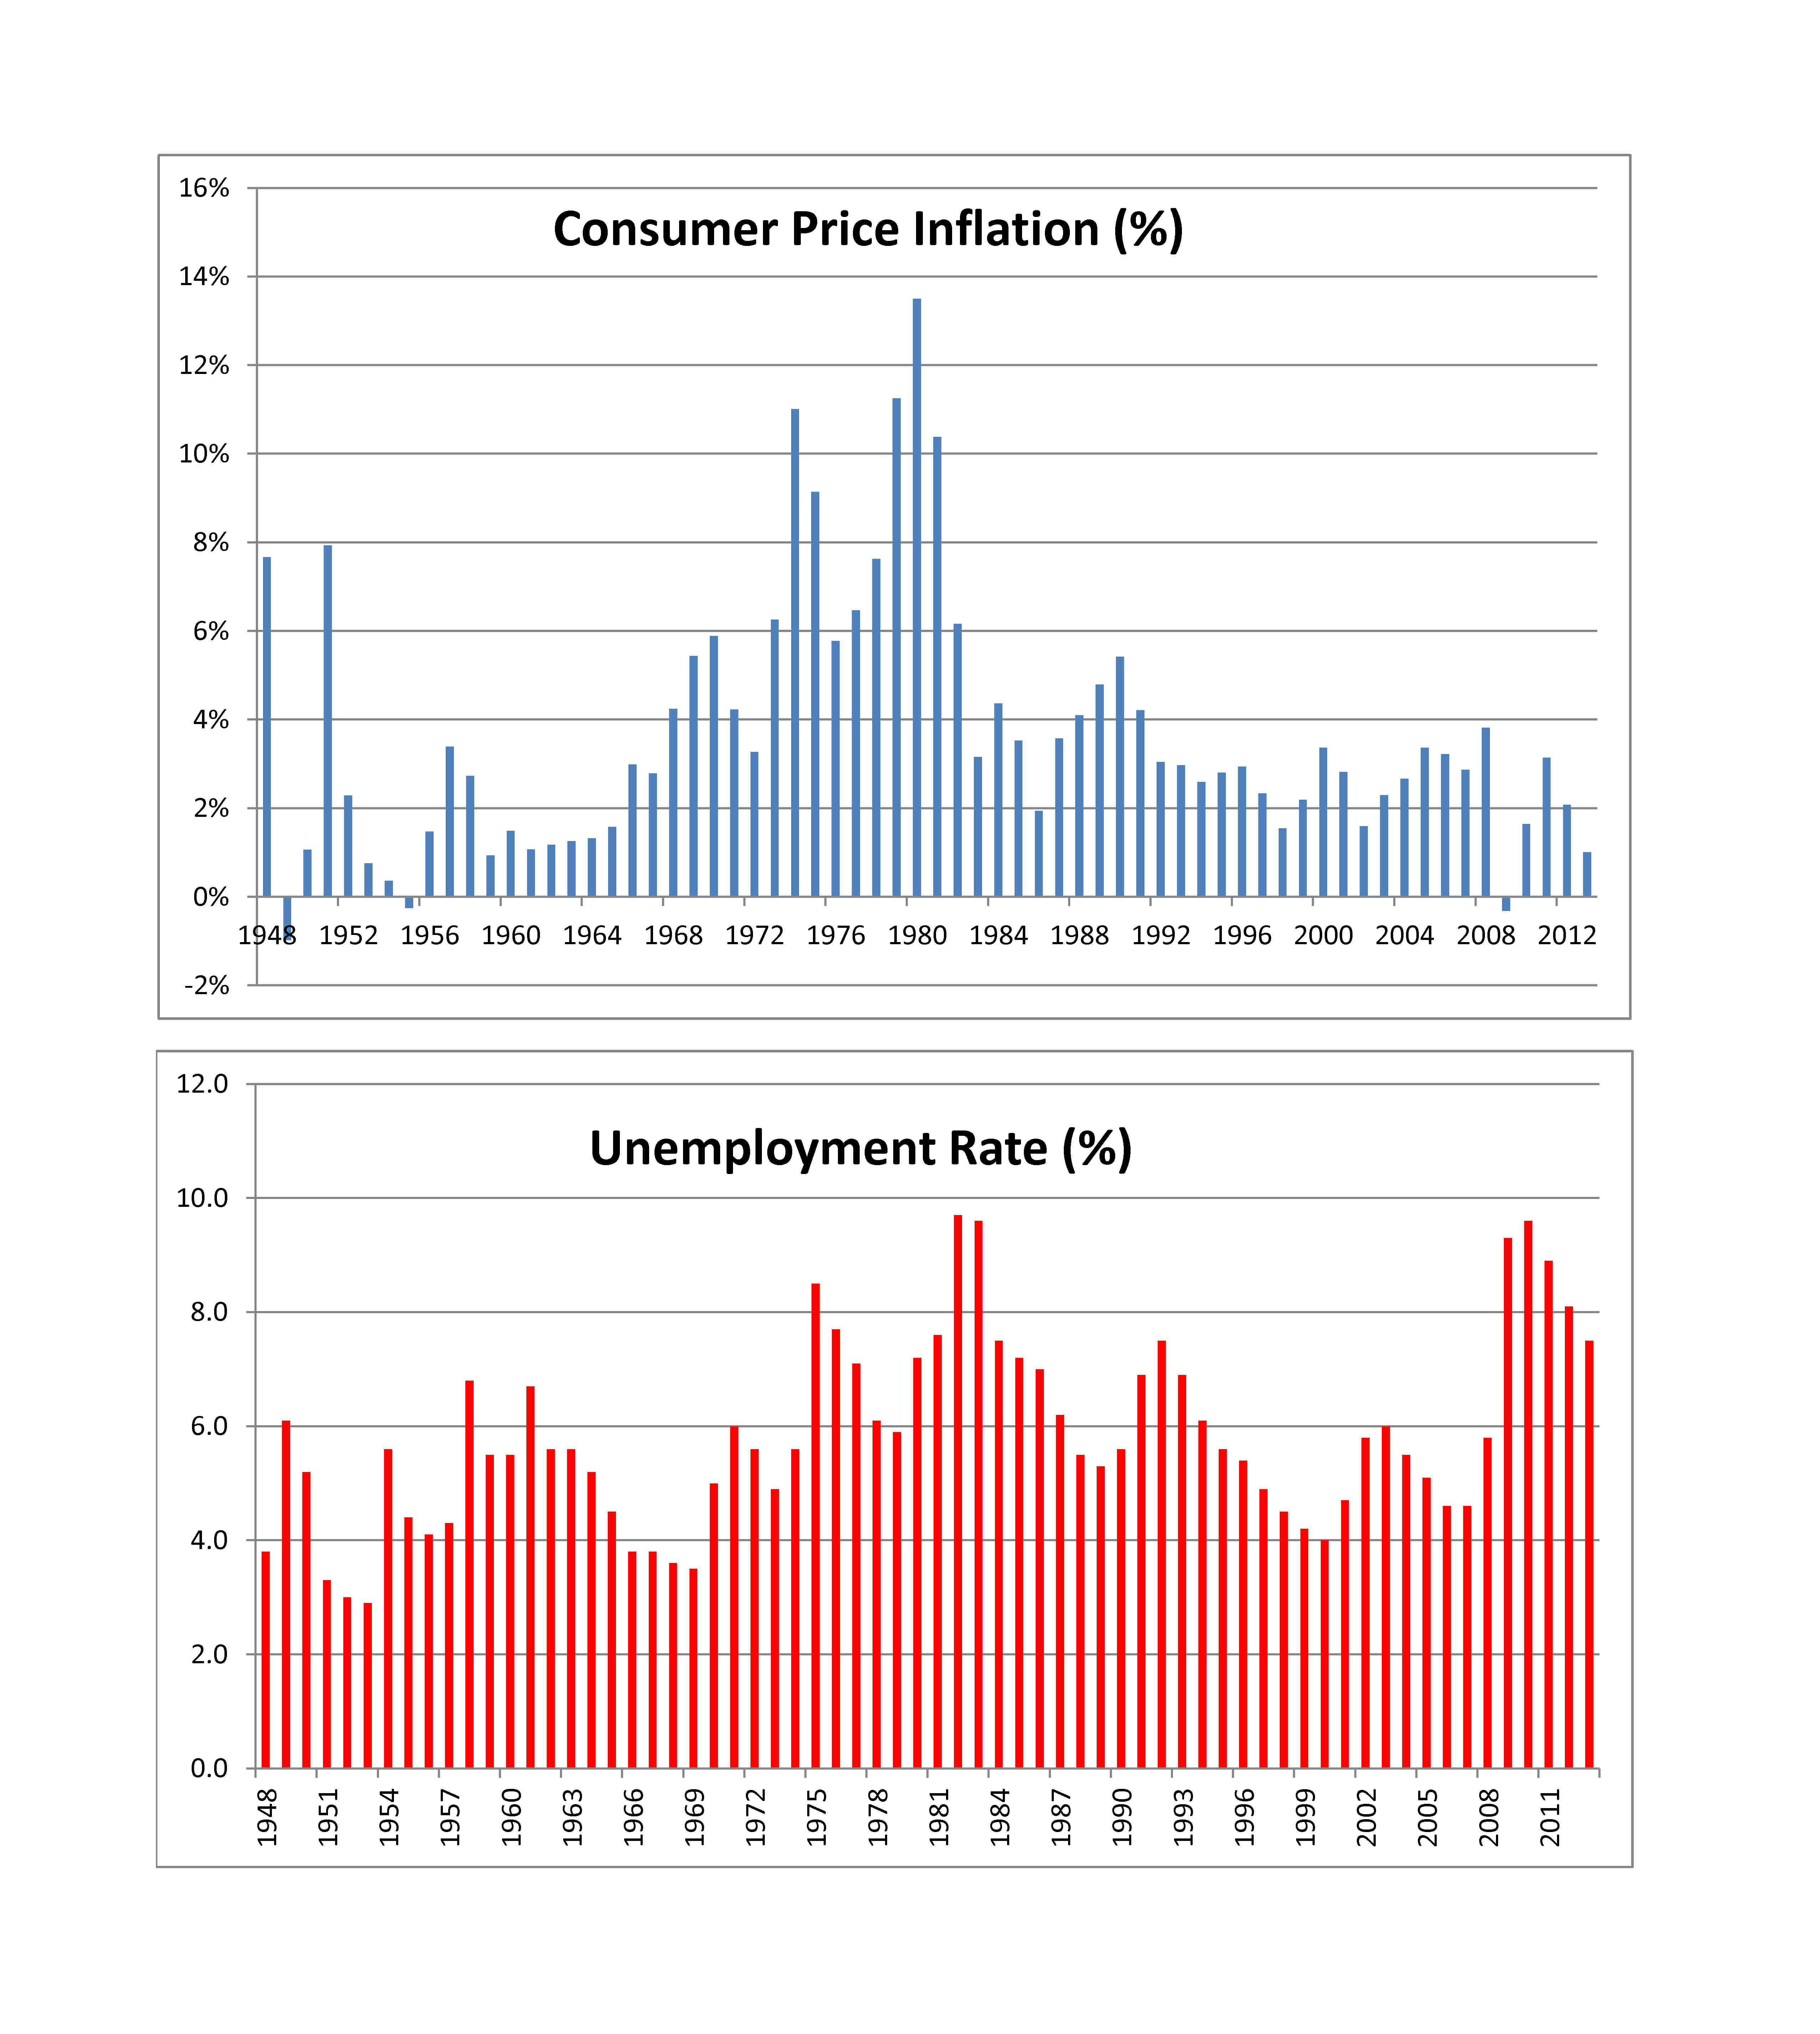
The charts show the twin concerns of the Fed: inflation and unemployment.  Despite fears that easy money would send inflation surging, it is quietly fading away.  The real worry is unemployment. While declining, at 7% recently it remains above any estimate of full employment.  Low inflation and low unemployment can be in conflict with one-another.  Cutting unemployment requires a stronger, faster growing economy while keeping inflation low can be helped by economic slack, minimal wage growth and a soft job market.  To add to the challenge of meeting two opposing targets, the Fed’s current policy tools — the Fed funds rate and buying bonds – are tightly linked and can’t easily target two conflicting goals.

In 2014 the Fed is expected to keep interest rates low with the Fed Funds rate targeted at zero to 25 basis points, essentially the zero lower bound (ZLB).  First, they have said so on numerous occasions, second with inflation at one percent and falling there is little justification for raising rates and third, many more analysts and investors argue about bond buying than about interest rates.  The bond buying, better known as quantitative easing or QE 1-2-3, will be cut back and probably extinguished completely in 2014.  The Fed began the shrinking process in December after a couple of false starts, markets surprisingly welcomed the change with a rally in both stocks and bonds and there does seem to be a limit to the size of the Fed’s balance sheet.  The chief fear engendered by bond buying was that massive increases money would turn into much higher inflation. That hasn’t happened. QE 1-2-3 generated a lot of hot air but no inflation.

What if the inflation fears aren’t misplaced?  Should prices begin to rise, the Fed would drop the ZLB target for Fed funds, interest rates would rise and any remaining bond buying would vanish.  Given the last few years of ZLB and QE 1-2-2, this doesn’t look very scary.  If unemployment doesn’t drop further, will there be a QE 4? While this is a harder question to answer, the response is no.  After three rounds of quantitative easing, the search would probably be on for other ways to boost the economy.  One side effect of QE 1-2-3 has been rapidly rising asset prices for both stocks and houses, fast enough to make some that whisper bubbles are here again.  The best alternative policies are outside the Fed’s domain: increased fiscal stimulus and a higher minimum wage. However, both attract politicians and 2014 is a Congressional election year and also the preliminary bout for 2016.  So the more exciting action may shift from the central bank back to the legislature after four or five years when the Fed seemed to be the only serious economic player.


The posts on this blog are opinions, not advice. Please read our Disclaimers.

A Review of the Financial Markets in 2013

Contributor Image
Dave Guarino

Director, Global Index Communications

S&P Dow Jones Indices

As part of its ongoing review of the financial markets in 2013, S&P Dow Jones Indices recently published four video interviews with senior index analysts that examine the drivers of market performance in 2013 and the news and events that could impact returns in 2014. Market segments discussed during these interviews include: the U.S. equity markets, economy, and housing U.S. fixed income, and global commodities markets.

To view the videos, please visit the multimedia section of www.spdji.com or click on the following links:

Silverblatt and Blitzer Look at 2013 and Beyond

Jodie Gunzberg Discusses the Commodity Markets in 2013

JR Rieger Discusses the Fixed Income Markets in 2013

David Blitzer on Changes to the S&P 500 and DJIA

The posts on this blog are opinions, not advice. Please read our Disclaimers.

What's Shocking About Commodities In 2014?

Contributor Image
Jodie Gunzberg

Former Managing Director, Head of U.S. Equities

S&P Dow Jones Indices

As 2013 is wrapping up and we look out to 2014, there are some key questions about the drivers and opportunities in commodities in the coming year, as discussed in this interview.

Below are some of the questions discussed PLUS a bonus question about metals.

Q1: Jodie, let’s talk about commodity performance in 2013.  It looks like the S&P GSCI is off about 1.9% (ytd through Dec 18, 2013)  and the Dow Jones UBS Commodity Index down 9.3%.  What market events pushed down the performance of these indices this year?  Given the commodities in each of the flagships is roughly the same, the most important factor for the performance difference between the indices is the weights.  Energy has been the only positively performing sector, up about 5%, which has really helped the S&P GSCI with about 70% of its weight in energy.  Agriculture, which has the second heaviest weighting in the S&P GSCI of about 15% lost 17% in 2013, led by corn and wheat, both in bear markets, down 29% and 27%, respectively, led by favorable weather and a stronger U.S. dollar.  However, from the different weighting scheme of the DJ-UBS, metals were the main culprit, led by gold. Gold lost 30% in 2013 on stronger sentiment about an economic recovery and has the biggest target weight in the index of over 10%. My last point about how much the constituents and weights matter is demonstrated by POSITIVE performance this year from the S&P World Commodity Index (WCI) that is ex-US. It has 22 commodities across eight international exchanges and is world production weighted, just like the S&P GSCI. While it was only up slightly, about 1%, it was the European commodities, led by Brent crude oil, that pushed the index into the black.

Q2: What type of head winds might the commodity market run into or continue to run into in 2014? Although commodity performance was largely negative in 2013, the severity was light for the risks that were and continue to be in the market.  The Chinese demand growth stayed on target, the U.S. did not default on its debt or fall off the fiscal cliff, and major crises were avoided in the Eurozone.  By now, it even seems that while the Fed tapering and Chinese demand growth are still hot topics for commodities as we enter 2014, the geopolitical environment like the Syrian tensions have overtaken the attention of the Eurozone crisis as a top driver of commodity performance.

Q3: What potential impact, if any, will the US oil production revolution have on the commodity markets and international oil prices? If the production grows more quickly than the technology and logistics can to transport it, then there may be inventory excess and price pressure like we’ve seen in WTI. What is more important to the indices about the U.S. energy revolution is how the weights are impacted.  From 2011-2014, the combined weight of WTI in the S&P GSCI and DJ-UBS has dropped by about 15% and has been mostly replaced by Brent.

Q4: Jodie, despite difficult returns this year, we’ve seen a mini-revival in commodity investing by pension funds and growing interest by individual investors.  What are some of the reasons for this and do we expect this trend to continue next year? The main reasons investors are turning to commodities are the same as throughout history, which are diversification and inflation protection with the potential of equity-like risk and returns. Although these reasons hold in the long run, many investors questioned the true diversification commodities provide since they fell in the financial crisis with each other and the other asset classes.  The risk-on/risk-off environment has proved difficult for commodities, especially as portfolio diversifiers to protect capital.  Today, there are new factors overtaking the risk-on/risk-off environment that are bringing down correlations to pre-crisis levels, which you can read more about here:precrisis correlations

As suppliers have reduced production post-financial crisis and inventories have been reduced, finally the  supply shocks, are driving commodity returns again and cause them to be different from each other and from equities and fixed income. This is creating the most opportunity for spread plays and diversification since 2007.

Bonus question: Will metals continue their downfall? The interesting thing about metals is the difference between the industrials and the precious metals.  Since 1995, there were 6 Novembers where industrial metals had negative returns and 5 out of those 6 times there was a negative December following.  This is not surprising given the sensitivity of industrial metals to the inventory situations.  Given the more difficult storage situations of some industrials like copper, it may be difficult for suppliers to meet the demand so the equilibrium is balanced by price, causing a persistent trend. [The possible reason for the persistence in realized roll yield may be, as discussed in Till and Eagleeye (2005), “if there are inadequate inventories for a commodity, only its price can respond to equilibrate supply and demand, given that in the short run, new supplies of physical commodities cannot be mined, grown, and/or drilled. When there is a supply/usage imbalance in a commodity market, its price trend may be persistent….“ ]

On the other hand, precious metals, which are well supplied and easy to store, have had 7 negative Novembers but only 3 of the following Decembers were down.

Source: S&P Dow Jones Indices. Data from Jan 1995 to Nov  2013. Past performance is not an indication of future results. This chart reflects hypothetical historical performance. Please see the Performance Disclosure at the end of this document for more information regarding the inherent limitations associated with backtested performance
Source: S&P Dow Jones Indices. Data from Jan 1995 to Nov 2013. Past performance is not an indication of future results. This chart reflects hypothetical historical performance. Please see the Performance Disclosure at the end of this document for more information regarding the inherent limitations associated with backtested performance

Different fundamentals that are more aligned with their “store of value” qualities like central bank buying and flight to safety, drive the precious metals. Since the precious metals are largely abundant, there is less trending from price as the calibrating factor to balance supply and demand.  Overall, it is not surprising that in all calendar months over the time span Jan 1995-Nov 2013, that industrial metals moved in the same direction as in the prior month 51% of the time, but precious metals only moved in the same direction as in the prior month 46% of the time.


The posts on this blog are opinions, not advice. Please read our Disclaimers.

Two Dimensions of Risk

Contributor Image
Craig Lazzara

Former Managing Director, Index Investment Strategy

S&P Dow Jones Indices

Investors have long regarded the market’s overall level of volatility as an indication of its riskiness.  The S&P 500 VIX Index, in particular, is often referred to as a “fear gauge” for U.S. equities since it tends to rise when investors are nervous and to fall when the markets are quiescent.

Although S&P 500 VIX has a strong claim to be primus inter pares in the volatility family, the family is large and growing.  Earlier this week we introduced a new volatility and dispersion dashboard designed to help investors analyze trends in VIX and to comment on their implications for market developments.  We were able to observe, e.g., that spot VIX was higher than the January VIX futures — an unusual alignment reflective of the market’s uncertainty about yesterday’s FOMC announcement.

Volatility gives us one way to measure risk, but vol itself is importantly influenced by a simpler but less well-known metric called dispersion.  Think of dispersion as the difference, over a given period of time, between the “best” and the “worst” performers in a market index.  If dispersion is low, the gap between “best” and “worst” shrinks.  When that happens, any strategy that deviates from cap-weighted indexing — from a disciplined factor index to the most aggressive fundamental stock picking — will have less opportunity to add value than it would have had in a period of high dispersion.  And when dispersion is low, other things equal, volatility will also tend to be low.

That’s the situation in which we find ourselves today.  Although VIX has risen in the last month, it’s still well below its typical levels.  Not surprisingly, stock market dispersion is also near its historical lows.  We’d expect that in such a low volatility, low dispersion environment, active alpha will be both scarce and small.

The posts on this blog are opinions, not advice. Please read our Disclaimers.

Facebook Selling Into the S&P 500

Contributor Image
David Blitzer

Former Managing Director and Chairman of the Index Committee

S&P Dow Jones Indices

Facebook (FB), the most-watched candidate for the S&P 500 all year, will join the index tomorrow night, December 20th , after the market closes. Once ETFs, index mutual funds and other index funds complete their buying – probably sometime next week – roughly 12% of FB’s shares will be held by indexers.  As many expected, the stock jumped up on our December 11th announcement that FB would join the index. Moreover, FB outperformed the S&P 500 from December 11th to yesterday (December 18th) by 9.5 percentage points.

Hedge fund and arbitrageurs sometimes trade index additions hoping to profit from the expected stock bounce.  Dating back to the tech boom of the 1990s, when index adds and drops first drew a lot of attention, the company joining the index often sells stock through a secondary offering to take advantage of the demand for shares created by the index addition. FB is following this pattern – it is offering 70 million shares of its class A common stock, about 3% of the current outstanding float. Included in the 70 million are about 41.4 million shares being sold by Mark Zuckerberg, FB’s founder.

The posts on this blog are opinions, not advice. Please read our Disclaimers.