Get Indexology® Blog updates via email.

In This List

Fixed Income Laddering

Municipal Bonds Bounce Off Bottom

JOIN US! LIVE-WEBCAST - S&P Dow Jones 7th Annual Commodities Seminar

If it ain't broke, don't VIX it

Capturing Global Flows: the S&P WCI

Fixed Income Laddering

Contributor Image
Kevin Horan

Former Director, Fixed Income Indices

S&P Dow Jones Indices

The Federal Reserve’s decision to continue its monthly stimulus purchases on Sept. 18, 2013, had a euphoric effect on the markets, as the S&P 500 immediately rose from 1702 to 1715, eventually closing the day at 1726. Treasuries reacted to the news in the same way, as yields on the 10-year Treasury went from 2.86% to 2.73%, finally ending the day at 2.68%. The market’s reaction is in stark contrast to the last few months of communication and preparation for a September tapering, as the expected change in policy was already priced into the market. The reasoning behind the Fed’s lack of action could be even more unsettling, as it points to continued weakness in the U.S. economic recovery. The Fed’s stimulus program must end at some point, and the question is when that point comes, will the markets heed the Fed’s communications and be as prepared as they were this go around? With that in mind, fixed income investors should be thinking about how to manage their portfolio in a rising interest rate environment.

Portfolio laddering is a traditional bond market strategy for investors during periods of rising rates. The underlying principle of the strategy is that while rates are rising, re-investment of returning short principal and interest at higher rates negates the negative price action. A ladder strategy can be structured from a variety of fixed-income products, including: Certificates of Deposit, Treasury notes, Agency notes, Municipal notes, and Corporate notes. Credit risk will factor into the selection choice but, depending on the length of the ladder, shorter maturities will have a smaller degree of risk.

The ladder provides better income and total returns when rates are rising than selecting a single security because of the strategies’ ability to re-invest maturing proceeds at more current rates. Creating a ladder strategy begins by combining similar or differing bonds in a portfolio with differing maturities in semi-annual or annual increments. As each bond rolls down the curve and matures, it is replaced by purchasing a similar security in current market conditions at the longest target date of the strategy. A common example would be a one- to five-year annual Treasury bond strategy. A year from now the one-year bond will mature and be replaced with a five-year security. Assuming yields have risen over that year, the five-year security that is added to the strategy will incrementally add yield to the portfolio. If the replacement bond is going to be a Treasury, choose the off-the-run rather than the on-the-run so that you’re not paying for liquidity premium, which is additional richness priced into the on-the-runs due to the demand by the repo markets.

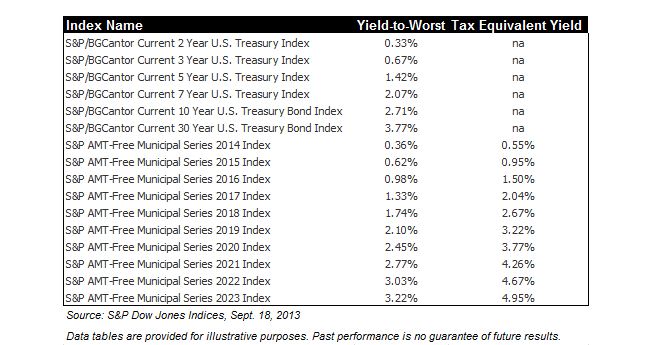
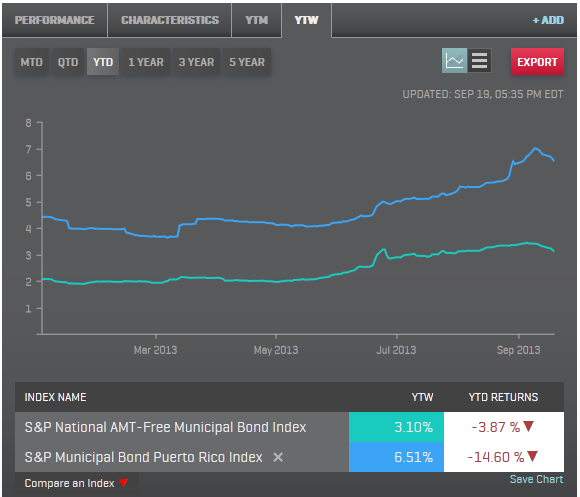
Indices can be a helpful way to study the performance of a ladder strategy. In some cases, the index may have an investible ETF issued against it, which gives an investors access to that segment of the market. The following table shows the current levels of yield within certain fixed income areas.

Fixed Income Laddering

The posts on this blog are opinions, not advice. Please read our Disclaimers.

Municipal Bonds Bounce Off Bottom

Contributor Image
J.R. Rieger

Former Head of Fixed Income Indices

S&P Dow Jones Indices

The US Municipal bond market has bounced off its recent bottom even as two anchors continue to weigh it down: Puerto Rico and tobacco settlement bonds.

Investment grade tax-exempt bonds tracked in the S&P National AMT-Free Municipal Bond Index have seen a 2.32% positive total return since it’s year to date low on September 5th 2013.  In less than two weeks, the weighted average yield to worst of bonds in the index has fallen from 3.43% to 3.10% or a 33bp improvement.  The S&P National AMT-Free Municipal Bond Index is still in negative territory for the year, down 3.87% year to date.  A drop off in new issue supply and yields reaching more attractive levels have combined to help bring prices back up.

Tracking Puerto Rico municipal bonds since December 1998, the S&P Municipal Bond Puerto Rico Index hit a record high yield on September 9, 2013 with the index reaching a weighted average yield of slightly over 7%.  Since that point, yields have improved by 49bps to end last night at a 6.51%.  As of last night, the yield for Puerto Rico bonds is more than double those of the average seen in the S&P National AMT-Free Municipal Bond Index.  This has been the worst quarter in the index history with a negative 12.68% return and so far the worst performing year with a year to date total return of negative 14.6%.

Yields: S&P National AMT-Free Municipal Bond Index V. S&P Municipal Bond Puerto Rico Index
Source: S&P Dow Jones Indices LLC and/or its affiliates.  Data as of September 19, 2013. Index performance based on total return USD.  Charts and graphs are provided for illustrative purposes.  Past performance is no guarantee of future results.

Tobacco settlement municipal bonds have had a good September so far helping to offset serious losses seen during the quarter.  The S&P  Municipal Bond Tobacco Index has recorded a positive 5.39% during September so far but for the quarter have returned a negative 4.37%.   The index has seen a year to date return of negative 7.66% helping to hold back the returns of the municipal high yield bond market.  The S&P Municipal Bond High Yield Index has seen a positive September month to date recording a positive 2.33% however is still in negative territory for the year with a – 4.7% return year to date.

Five year municipal bonds tracked in the S&P AMT-Free Municipal Series 2018 Index have rebounded as yields have come down by 18bps over the course of the month to end at 1.69%.

The ten year maturity range of the municipal bond market has seen a nice rally.   Ten year municipal bonds tracked in the S&P AMT-Free Municipal Series 2023 Index have seen yields come down by 39bps this month driving a total return of 3.18% month to date.

A more detailed discussion on the municipal bond market is scheduled for October 17th in NYC.  To learn more about attending this complimentary forum please click here.

The posts on this blog are opinions, not advice. Please read our Disclaimers.

JOIN US! LIVE-WEBCAST - S&P Dow Jones 7th Annual Commodities Seminar

Contributor Image
Jodie Gunzberg

Former Managing Director, Head of U.S. Equities

S&P Dow Jones Indices

Please click here to register for our live-streaming of S&P Dow Jones Indices half-day complimentary seminar which has become Europe’s annual meeting point for commodity aficionados in less than a decade.

It is the perfect opportunity for all who can’t attend in-person to join us and other leading industry professionals for an afternoon of education and interactive sessions. Take a front row seat to walk away with valuable insights into current trends and issues under the umbrella of who’s complaining, who’s hedging, who’s speculating, who’s to blame and finally, where do I go?

Our speakers will examine:

– What causes spikes in commodity prices and how regulation is impacting commodity investment in modern market times.
– Perspectives on what the speculators are doing versus who are the hedgers, and why the lines might not be so clear.
– What incidental factors are tipping the market and the limitations for producers and consumers?
– What’s driving the world’s demand economy today and where it might be heading.
– The latest techniques in managing commodity index exposures in potentially uncertain times.

The posts on this blog are opinions, not advice. Please read our Disclaimers.

If it ain't broke, don't VIX it

Contributor Image
Tim Edwards

Managing Director, Index Investment Strategy

S&P Dow Jones Indices

Within the last week, we’ve read about threats of another war in the Middle East, collapsing currencies across emerging markets, imminent rumblings of yet another Greek bailout.  As of this writing, there is one day left until the Fed’s much anticipated pronouncement on the “end” of QE.  Talk abounds of September being the worst month for stocks; October’s record is blackened with crashes.  And yet: yesterdays’ close of 14.16 for the most widely followed barometer of fear, the CBOE Volatility Index (VIX), is close to a third below its 10-year average. Has the VIX, the vaunted “fear gauge,” ceased to reflect true market anxiety? 

Figure 1

It’s worth pointing out that  VIX markets are not predicting an easy ride forever.  The VIX index represents a blended expectation of S&P 500® Index volatility for the next 30 days; futures on the VIX Index extend the forecast to supply longer-term volatility expectations.  As shown above, these futures prices increase steeply to a level in line with VIX’s 10-year average.  Given that this 10 year interval includes both the “great moderation” of 2003-2008 as well as the subsequent five years since the bankruptcy of Lehman Brothers, the bigger picture for volatility seem neither particularly bullish or bearish.

In the past few years – characterized by alternating risk-on, risk-off dynamics – the VIX has been a remarkably effective proxy for optimism or fear across multiple international markets.  Five years on there is growing evidence that investors’ formerly incontinent risk appetite is becoming more discriminating.   A case in point is provided by comparing U.S. and emerging market equities: the current correlation (0.56) is above levels prevalent prior to the crisis, but well below the majority of readings since.   Figure 2

One potential conclusion is that the U.S. equity market is more independent, so that volatility in EM equity is no longer of great concern.  Does the VIX still serve as a global systemic risk indicator?

But perhaps we are asking the wrong question.   An errant correlation can always be found somewhere, then shoehorned into justifying a new era of market dynamics.  Perhaps current low VIX levels are accurately reflecting a globalized and coordinated risk-on environment.  After all, it is not difficult to find reasons to be cheerful. The extent of ‘tapering’ has arguably been largely discounted; a surprising Fed announcement would be highly uncharacteristic. The world’s advanced economies are recording concerted positive growth; the likelihood of a fully-fledged combat operation by NATO allies in Syria is receding at considerable pace.  A Greek bailout, while politically awkward, is highly unlikely to shock a well-informed market.  Even the much-battered rupee is showing signs of stabilization.

Such arguments provide little reason to demote the VIX Index from its privileged position as the primary indicator of global greed and fear.  If the relative independence of EM and U.S. equities has indeed increased, it has done so because of a reduction in the perceived importance of systemic risk factors (in which case a “low” VIX is arguably justfied).  And if systematic global risk should increase, the unparalleled systemic importance of the U.S. equity market will mean that the VIX is uniquely positioned to reflect the evolving impact of such risks.

The posts on this blog are opinions, not advice. Please read our Disclaimers.

Capturing Global Flows: the S&P WCI

Contributor Image
Nicholas Kennedy

Head of Business Development

NYSE Liffe

Commodity indices have seen tremendous success as investors look for asset diversification in their portfolio; simple exposure to the asset class; or even a hedge against inflation. Historically, the main commodity indices have been very much US centred and predominately denominated in USD. Why? The main reason is that these indices use exchange traded commodity futures to base their prices on and for many years, these have been listed in the US on US exchanges. Over recent years however, there has been a strong growth in volumes on non-US exchanges, and this has been particularly the case in agricultural derivatives. Europe for example has a physical wheat market which is over twice the size of that in the United States; however due to the lack of a reliable commodity futures contracts in Europe for many years, it was difficult to gain appropriate exposure. This has changed dramatically since the Common Agricultural Policy (CAP) stopped artificially supporting prices in grains in Europe in the early 2000’s. Since then, the Europeans grains futures markets were able to develop.

Nearly 10 years on and the European Wheat and Rapeseed contracts, operated by NYSE Liffe (NYSE Euronext group), have literally exploded and established themselves as global reference prices for European Wheat and Rapeseed.

S&P’s recently launched WCI was one of the first global commodity indices to understand this and has included these contracts, as well as our soft commodity contracts out of London, into their indices. With this index investors can now obtain easy exposure to these major trading flows in Wheat and Rapeseed.

S&P Dow Jones Indices is an independent third party provider of investable indices.  We do not sponsor, endorse, sell or promote any investment fund or other vehicle that is offered by third parties. The views and opinions of any third party contributor are his/her own and may not necessarily represent the views or opinions of S&P Dow Jones Indices or any of its affiliates.

The posts on this blog are opinions, not advice. Please read our Disclaimers.