Get Indexology® Blog updates via email.

In This List

Explore the Fast-Growing S&P Composite 1500 Internet & Direct Marketing Retail Index

Even Smarter Beta in South Africa? – Diversifying and Optimizing

Exploring New Tools for ESG Implementation in Australia

Changes to the S&P/ASX 300 Shareholder Yield Index Explained

Gold and U.S. Treasuries Helped the S&P MARC 5% Index Performance YTD

Explore the Fast-Growing S&P Composite 1500 Internet & Direct Marketing Retail Index

Contributor Image
Rachel Du

Senior Analyst, Global Research & Design

S&P Dow Jones Indices

Technological advancements and resulting social transformations have changed our daily lives. Traditional retailers have increased their usage of business channels such as the internet, mail order, and TV home shopping to attract their customers. The trend of this business transition has been reflected in the stock market.

Among all the 68 industry indices in the S&P Composite 1500® as of July 31, 2020, the Internet & Direct Marketing Retail industry stood out with its rapid growth of market share. The S&P Composite 1500 Internet & Direct Marketing Retail Index includes companies providing retail services primarily on the internet and through mail order and TV home shopping retailers, as well as companies providing online marketplaces for consumer products and services. Within the S&P Composite 1500, the weight of the S&P Composite 1500 Internet & Direct Marketing Retail Index grew from 0.06% at the end of 1994 to 5.00% as of July 31, 2020.

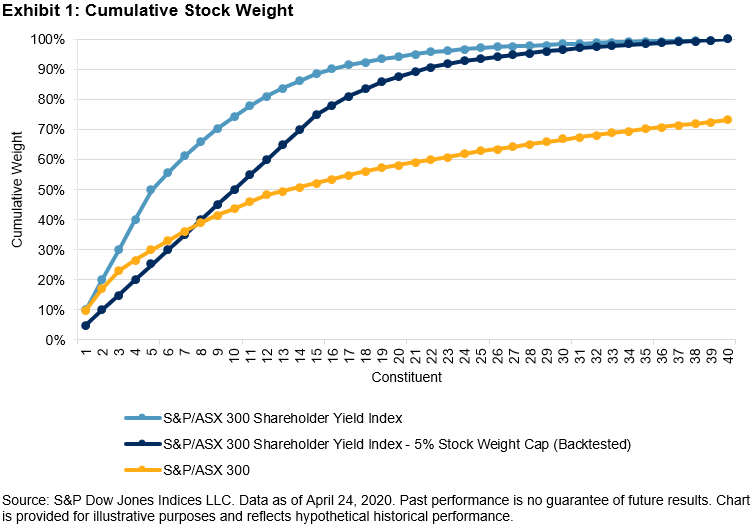
The market value of the industry has also increased significantly, particularly in recent years. Exhibit 1 shows that the industry has expanded over the past 15 years. The float market capitalization of the S&P Composite 1500 Internet & Direct Marketing Retail Index grew more than 600 times its original size at the end of 1994. Meanwhile, the rest of the industries in the S&P Composite 1500 had an average sixfold increase in terms of float market capitalization. As of July 31, 2020, the industry had USD 1,468 billion in float market capitalization, with Amazon.com Inc., Booking Holdings Inc., and eBay Inc. being its largest companies.

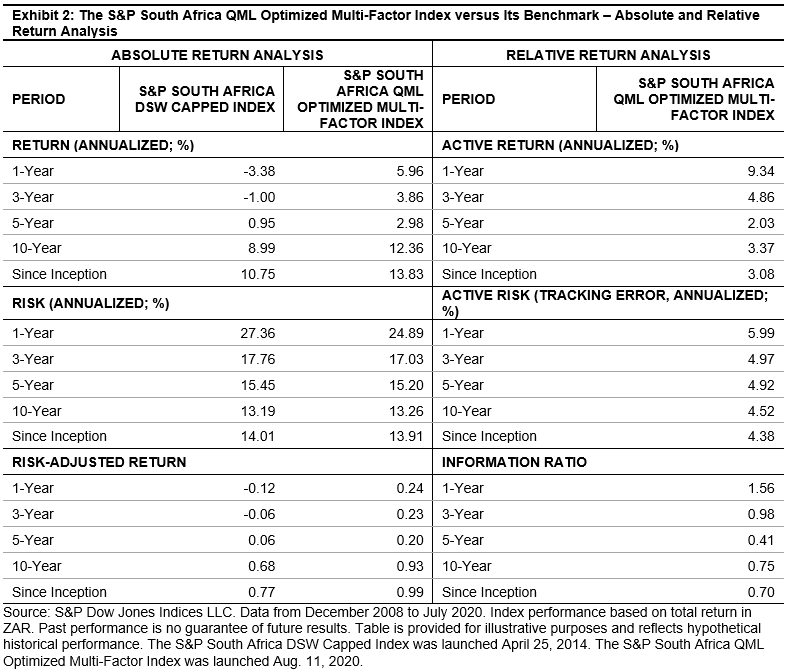
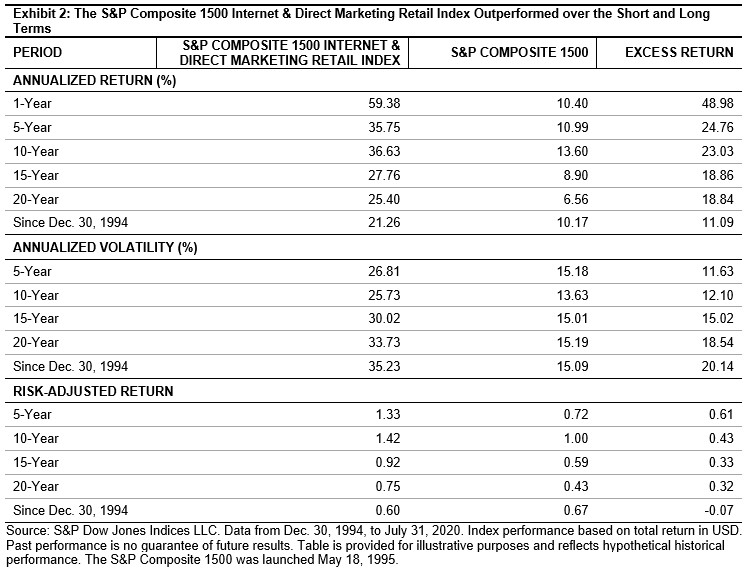
The S&P Composite 1500 Internet & Direct Marketing Retail Index delivered significant outperformance over the short- and long-term investment horizons (see Exhibit 2). During the past 5- and 10-year periods, the industry index provided risk-adjusted returns of 1.33 and 1.41, respectively, compared with the 0.72 and 1.0 generated by the S&P Composite 1500 during the same respective periods.

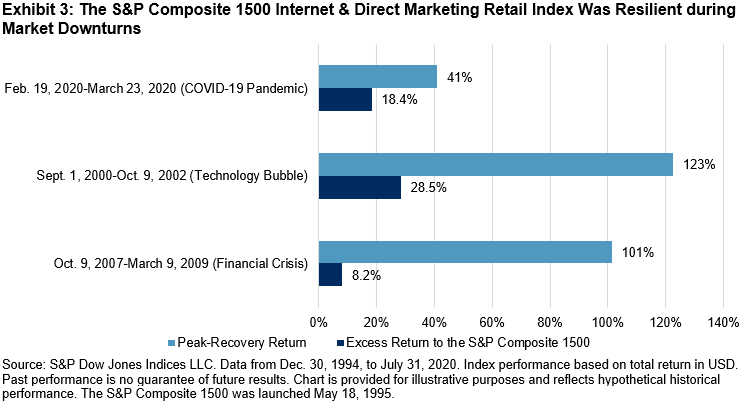
During market downturns, the industry demonstrated its strong resilience and ability to quickly recover. Exhibit 3 shows how the S&P Composite 1500 Internet & Direct Marketing Retail Index performed when experiencing the three worst market pullbacks, as measured by the S&P Composite 1500. The industry produced large margins of excess returns during the down markets and rebounded with powerful returns. The YTD return of the index as of July 31, 2020 was 61.27%, compared with 1.24% for the overall market.

The evolution of technology has encouraged the growth of online business. This trend is visible in the growth of the S&P Composite 1500 Internet & Direct Marketing Retail Index. Understanding the transformed economic reality can help identify potential investment opportunities.

The posts on this blog are opinions, not advice. Please read our Disclaimers.

Even Smarter Beta in South Africa? – Diversifying and Optimizing

Contributor Image
Andrew Innes

Head of Global Research & Design

S&P Dow Jones Indices

The equity risk premia from factors (such as quality, momentum, and low volatility) have been widely accepted and adopted by investment practitioners across the globe and South Africa alike. The belief by many is that exposure to these risk factors, in addition to the market, could reward investors over the long term.

While the long-term outperformance of most factors can be backed by economic rationale, each is still susceptible to significant drawdowns over short-term horizons. Timing factor exposures is one option to avoid this; however, it may require a crystal ball to navigate the markets. Better yet, diversifying across multiple factors at once could offer a more attractive solution. Since factor returns are relatively uncorrelated, the benefits of diversification may generate more stable excess return outcomes.

The new S&P South Africa Quality, Momentum & Low Volatility (QML) Optimized Multi-Factor Index adopts this philosophy and aims to systematically capture multiple risk premia simultaneously through an optimization approach. Exhibits 1 and 2 show the back-tested results of this strategy, which has been effective to date.

The primary objective of the multi-factor index seems simple enough; select stocks with the best quality, value, or momentum exposure. However, practically implementing this selection while adhering to other portfolio concerns can be fraught with challenges. For instance, how does one ensure that:

  • The intended factor exposures are well balanced;
  • The unintended sector exposures are limited;
  • The tracking error to the benchmark index is controlled; and
  • The turnover is low, efficient, and liquid to minimize trading costs and ensure capacity?

Optimizing the portfolio selection process is arguably the simplest way to solve this complex predicament. Through the power of a portfolio optimizer, its accompanying risk model, and S&P DJI’s Factor Scores, the solution reveals itself.

A mathematical optimization process is employed to help discover the most suitable stock selection and weighting that meet the objective to maximize multi-factor exposure, while abiding by any portfolio constraints. The constraints are simply a set of rules that help define the characteristics of the index.

In the case of the S&P South Africa QML Optimized Multi-Factor Index, these constraints include the following:

  • Balanced active factor exposures to quality, momentum, and low volatility;
  • Sector weights between 50%-150% of its benchmark weights;
  • Predicted tracking error to the benchmark index targeting 4%;
  • Quarterly two-way turnover of no more than 25%; and
  • The turnover of any position (i.e., each trade) should reflect the available liquidity.

In summary, the S&P South Africa QML Optimized Multi-Factor Index has historically achieved systematic diversification across factors through the powerful precision of its optimization process. Its controlled tracking error to the benchmark may also make it attractive to market participants looking for a core holding. Equally, those typically enticed by active funds’ promise of potentially higher returns could be compelled by the index’s historical performance, not to mention the relative advantages of lower cost and greater transparency associated with passive products. Either way, the S&P South Africa QML Optimized Multi-Factor Index may represent the next generation of smart beta for South Africa.

The posts on this blog are opinions, not advice. Please read our Disclaimers.

Exploring New Tools for ESG Implementation in Australia

As modern ESG strategies built on core indices like the S&P/ASX 200 ESG Index arrive, advisors and asset managers are increasingly asking – How does ESG work in purpose-built portfolios? S&P DJI’s Stuart Magrath joins SSGA’s Meaghan Victor to discuss what ESG implementation looks like in practice.

Learn more: www.spglobal.com/spdji/since-2000


The posts on this blog are opinions, not advice. Please read our Disclaimers.

Changes to the S&P/ASX 300 Shareholder Yield Index Explained

Contributor Image
Izzy Wang

Senior Analyst, Factors and Dividends

S&P Dow Jones Indices

The S&P/ASX 300 Shareholder Yield Index consists of the 40 stocks from the S&P/ASX 300 with the highest shareholder yield, which is a combination of dividend yield and buyback yield. In order to achieve sustainable performance, the eligible stocks are screened for liquidity, free cash flow, and dividend growth.

After consultations with market participants, S&P Dow Jones Indices (S&P DJI) has updated the methodology, effective Aug. 12, 2020. The index will go through the following two major changes this year, which will target to improve index diversification and maintain ongoing shareholder yield, respectively:

  1. Constituents will be subject to a lower weight cap of 5%, effective from the October 2020 rebalancing; and
  2. A monthly dividend review commenced from August 2020.

Lower Weight Cap on Individual Securities

The index constituents are weighted by product of float-adjusted market cap and shareholder yield. Currently, each constituent is subject to a maximum weight of 10%.

By lowering the constituent weight cap from 10% to 5%, stock concentration could be further reduced. Exhibit 1 illustrates the cumulative stock weight with the current 10% capping versus a hypothetical 5% capping, as of April 24, 2020, the most recent rebalancing. Compared with the current 10% capping, the 5% capping could help to reduce the weight of the top constituents (see Exhibits 1 and 2).

As the single-stock concentration becomes lower, sectoral balance might improve. As shown in Exhibit 3, the weight in Materials, the largest sector in the S&P/ASX 300 Shareholder Yield Index, would drop from 32.4% to 20.0%. Since 2015, the index included two big 4 banks for most of the time, which took up 20% of the index’s weight under the current 10% capping rule. Had the new 5% capping rule come in effect, the weight of the big 4 banks would have decreased to 10%.

Exhibit 4 shows the actual index performance as of July 31, 2020, and the hypothetical results had the proposed constituent weightings change been in effect.

Monthly Dividend Review

Currently, the S&P/ASX 300 Shareholder Yield Index rebalances twice a year in April and October. The semiannual rebalance includes a full review of index constituents and weighting to ensure alignment with the index methodology.

To minimize the impact on index shareholder yield, S&P DJI introduced the monthly dividend review, which is intended for maintenance, typically to remove stocks that have cancelled their dividends.

At the end of every month, the index committee will go through the constituents to identify stocks that have eliminated or suspended their dividends or omitted a payment. Those stocks will be removed from the index on the last day of that month and will not be replaced until the next annual rebalancing.

In August 2020, the S&P/ASX 300 Shareholder Yield Index went through its monthly dividend review for the first time. S&P DJI announced five drops that would be effective after the close of Aug. 31, 2020 (see Exhibit 5).

We believe these changes could help the S&P/ASX 300 Shareholder Yield Index maintain shareholder yield and reduce concentration risk.

The posts on this blog are opinions, not advice. Please read our Disclaimers.

Gold and U.S. Treasuries Helped the S&P MARC 5% Index Performance YTD

Contributor Image
Karina Tjin

Former Analyst, Strategy Indices

S&P Dow Jones Indices

Despite substantial market volatility and significant drawdowns in the first quarter of 2020, the S&P MARC 5% Index ended the quarter in positive territory (see The Importance of Asset Class Diversification: A Performance Analysis of the S&P MARC 5% Index). With markets staging impressive rebounds, we take a renewed look at the performance of the S&P MARC 5% Index on a YTD basis.

Exhibit 1 shows that the S&P MARC 5% Index had similar returns in Q2 2020 (2.5%) as it did in the first quarter (2.9%). The index returned 8.4% through the end of August 2020.

The underlying components that make up the index are equities, U.S. Treasuries, and gold. Equities (S&P 500®) ended Q1 2020 down 19.9%, but bounced back in Q2 2020 to return 20.5%. Through the end of August 2020, equities returned 9.4%. While the performance of the S&P 10-Year U.S. Treasury Note Futures Index in Q2 2020 dropped compared with that of Q1 2020, it still delivered a YTD return of 8.8%. With more investors turning to gold, the S&P GSCI Gold posted positive returns throughout the year, with an impressive 26.2% return YTD—which is the second-highest annual return (YTD) in the past 10 years.

Looking at the underlying asset allocations, the S&P MARC 5% Index allocated over 100% all together to cash, gold, and U.S. Treasuries in Q1 2020 (see Exhibit 2), with an average allocation of 22.5% to equities, 57.6% to U.S. Treasuries, and 23.8% to gold. As volatility picked up in March 2020, the total asset allocation dropped quickly to less than 50% in order to meet the index’s 5% volatility target.

Following March 2020, allocations remained subdued throughout Q2, particularly for the riskiest asset class, equities. On average, the index allocated 6.0% to equities, 42.0% to U.S. Treasuries, and 11.1% to gold in Q2 2020. However, during the last week of July 2020, the index resumed using leverage and allocated over 100%, demonstrating its ability to react quickly to changing market conditions. We note that the index’s recent performance was mainly driven by its allocation to gold and U.S. Treasuries, as its allocation to equities has continued to remain low.

Comparing the S&P MARC 5% Index to the broader market historically, it outperformed the S&P 500 in 14.2% of up-market months and 90.3% of down-market months (see Exhibit 3). In addition, during those down-market months, the index outperformed the S&P 500 on average by 1.3%. The strong performance in down-market months seems to be attributable to the index allowing dynamic allocation shifts in order to maintain the volatility target in times of high volatility.

The posts on this blog are opinions, not advice. Please read our Disclaimers.