Get Indexology® Blog updates via email.

In This List

Forecasting Tomorrow’s Dividends: Introducing the S&P/TSX Composite High Dividend Growth Index

SPIVA Special Report: Heroes in Haystacks

S&P Momentum Indices Shine in April Rally

Beyond Mega Caps: Navigating Concentration and Diversification in Crypto Index Construction

Firewall as the Frontline

Forecasting Tomorrow’s Dividends: Introducing the S&P/TSX Composite High Dividend Growth Index

Contributor Image
George Valantasis

Director, Factors and Dividends

S&P Dow Jones Indices

Introduction

As an industry leader in dividend index development, S&P Dow Jones Indices (S&P DJI) is committed to launching new and innovative dividend indices across global markets. The newly launched S&P/TSX Composite High Dividend Growth Index reflects this, representing the first application of the S&P Global Market Intelligence Dividend Forecasting Dataset within the S&P/TSX Composite Index universe. The index employs a distinct methodology, selecting companies that have demonstrated stable or growing dividends over the past five years and are projected to deliver the highest dividend yield growth going forward.

In this blog, we will explore the index’s methodology, historical outperformance, enhanced dividend yield and growth, as well as sector allocations versus the S&P/TSX Composite Index.

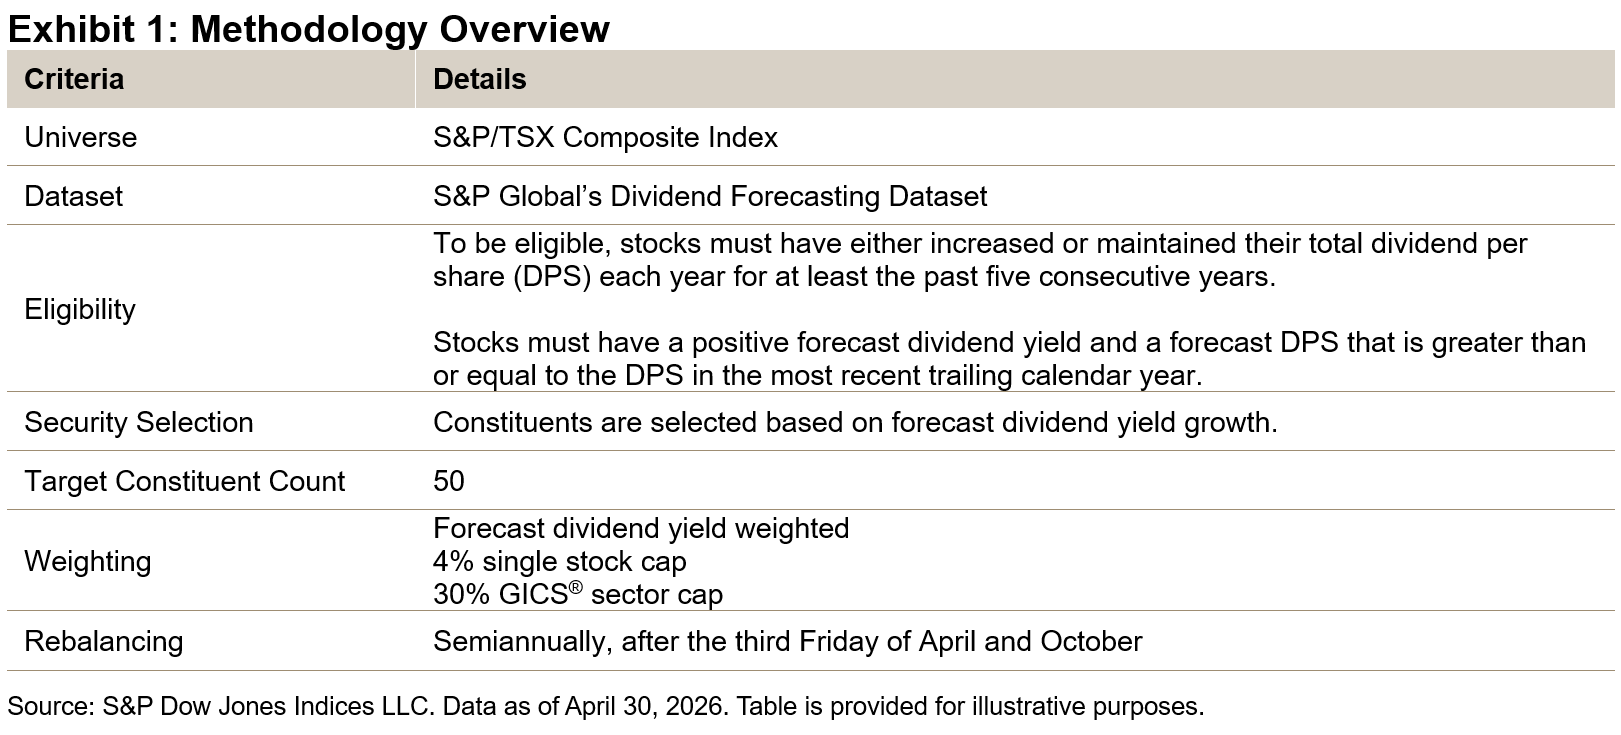
Methodology Overview

To be eligible for selection, constituents must have maintained or grown their dividends for at least five consecutive years, and they must also be projected to continue to do so over the next 12 months.

The index selects the top 50 constituents exhibiting the highest forecast dividend yield growth, determined by subtracting the 12-month historical yield from the 12-month forecast yield. Constituents are then weighted according to their forecast dividend yield, subject to stock and sector constraints.1

Performance Comparison

Using back-tested data starting April 2010, the S&P/TSX Composite High Dividend Growth Index outperformed the S&P/TSX Composite Index, both on an absolute and risk-adjusted basis (see Exhibit 2). Additionally, the index has demonstrated asymmetric capture ratios, participating in over 93% of the benchmark’s upside while the downside capture ratio was less than 78%.

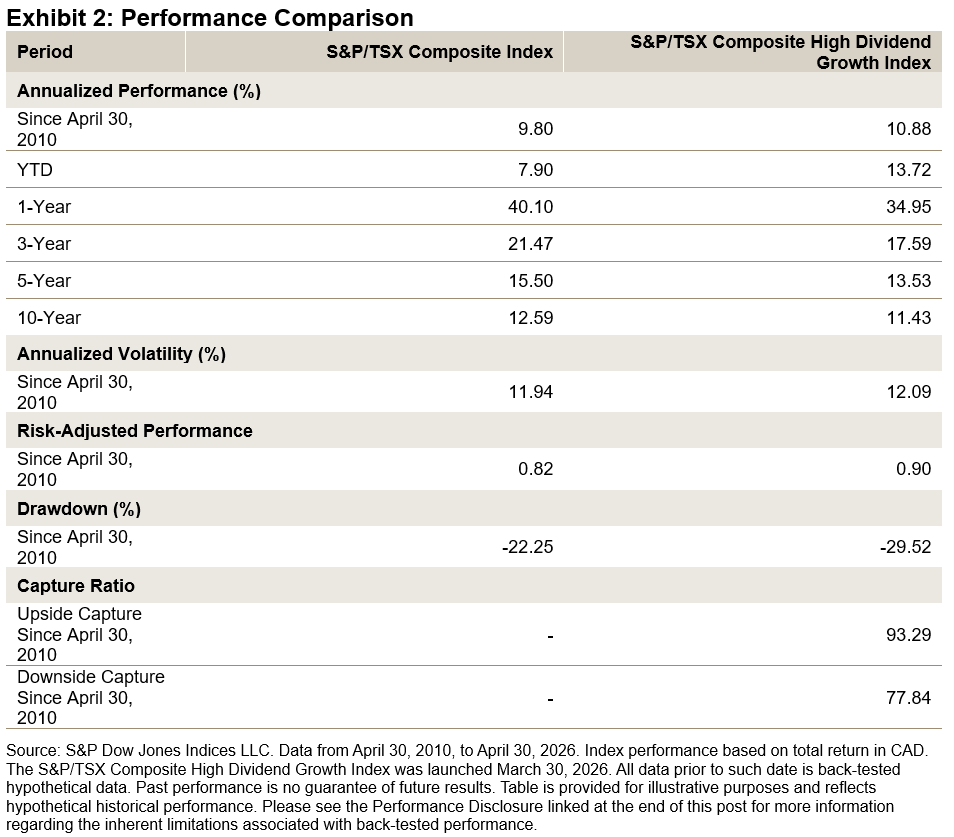
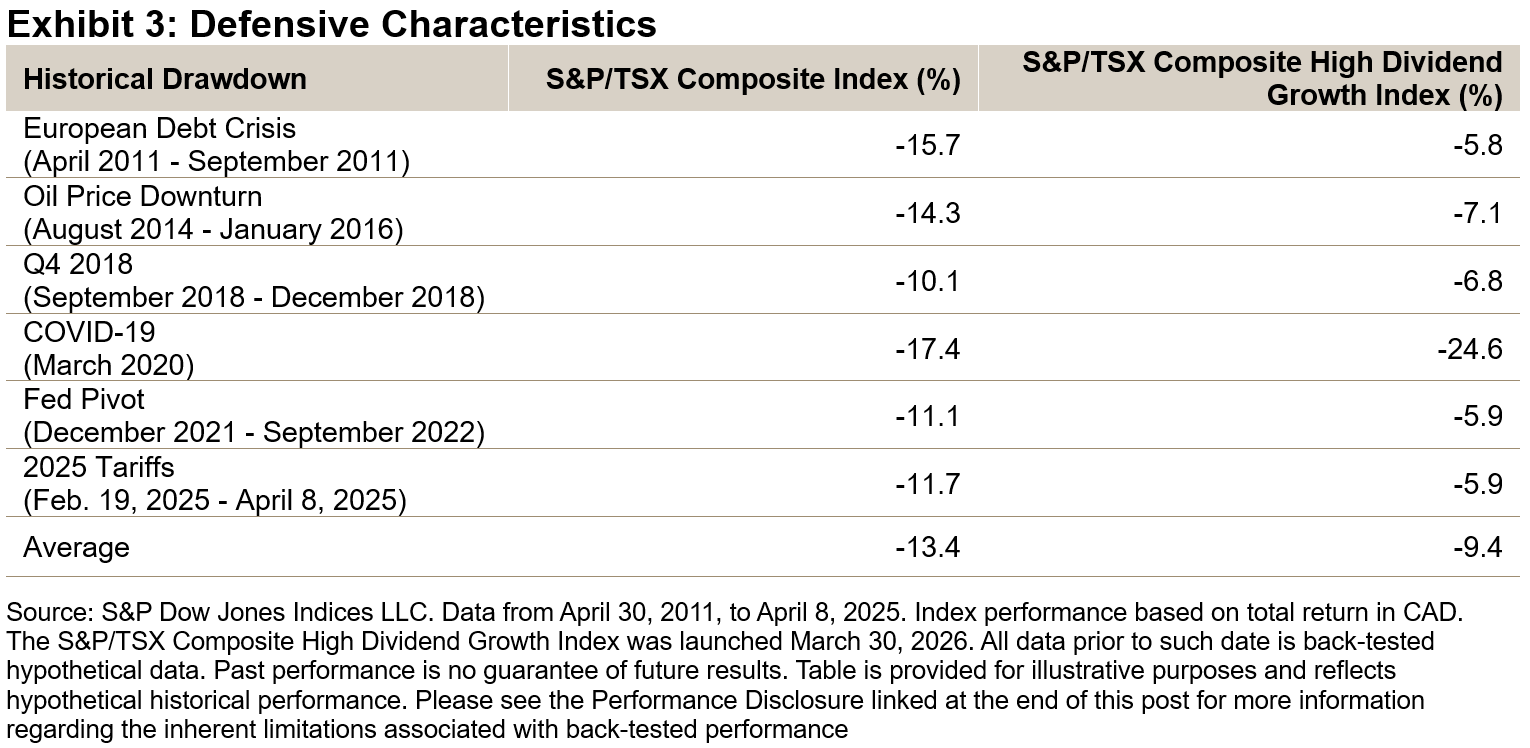
Beyond its strong downside capture, the index has shown notable downside protection during historical drawdown periods over the back-tested period, outperforming the S&P/TSX Composite Index in five out of six major drawdowns, with the exception of the March 2020 COVID-19 downturn. On average, the S&P/TSX Composite High Dividend Growth Index experienced a drawdown of -9.4%, compared to -13.4% for the S&P/TSX Composite Index, equating to less than 70% of the benchmark’s downside.

Dividend Comparison

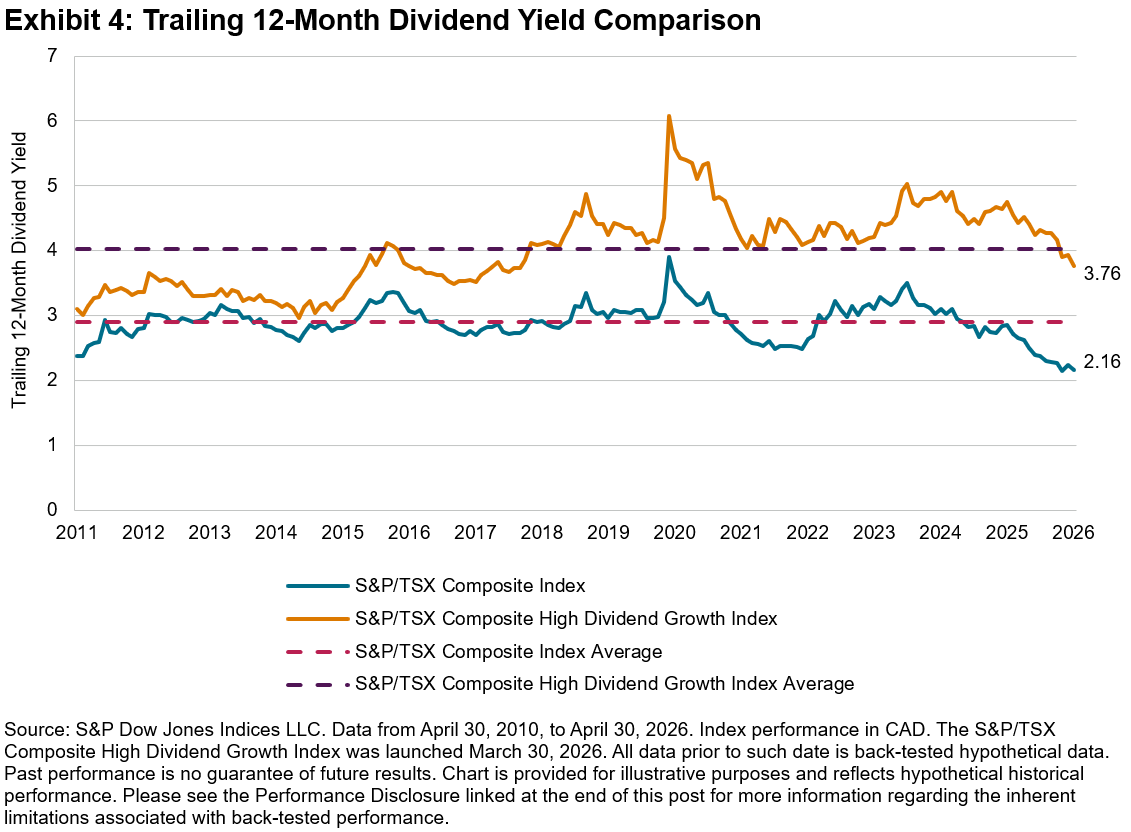
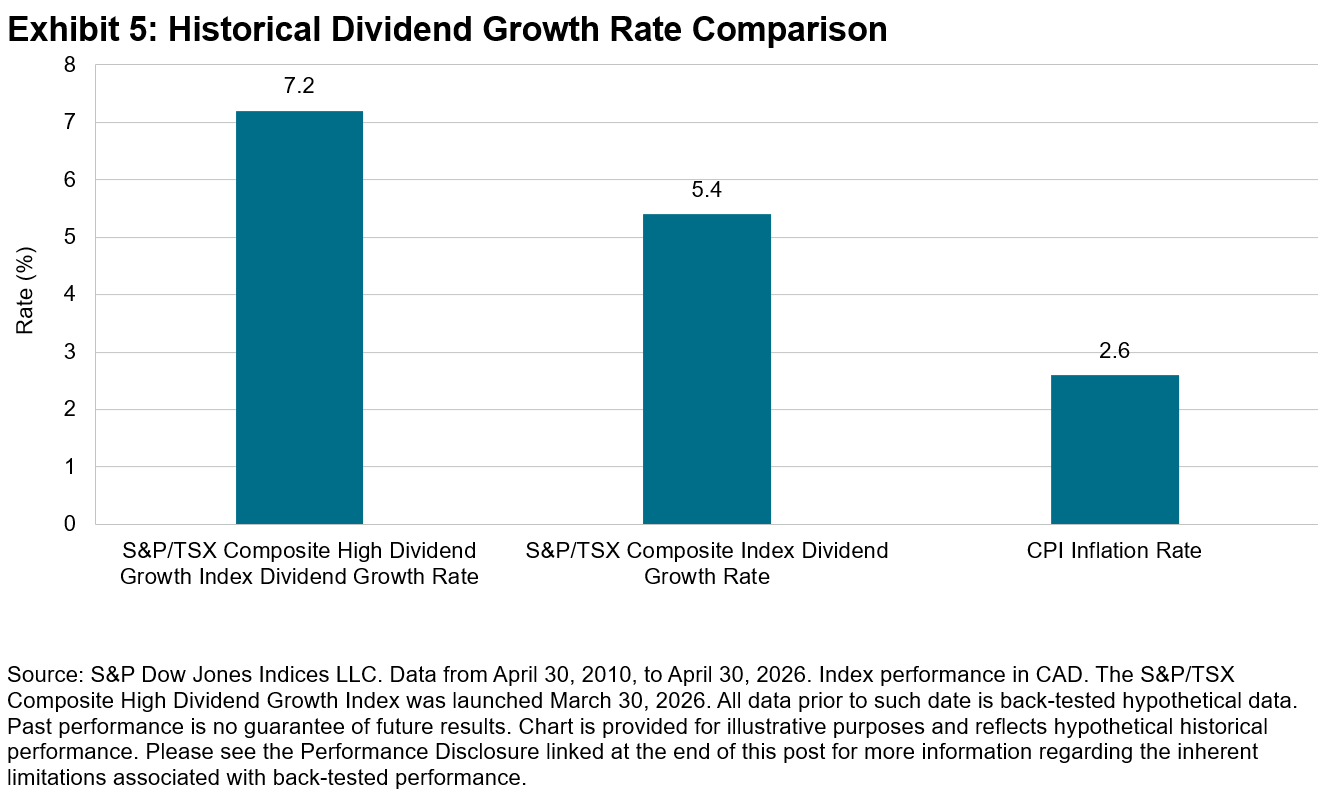
A distinctive feature of the index methodology is its selection of constituents based on forecast dividend yield growth, rather than DPS growth. This important distinction has historically resulted in the index reflecting a combination of both strong current yield and anticipated future dividend growth (see Exhibits 4 and 5).

As of April 30, 2026, the S&P/TSX Composite High Dividend Growth Index had a yield of 3.76%, standing 1.60% above the S&P/TSX Composite Index’s yield of 2.16%. This yield premium exceeds the historical average spread of 1.12% by 38 bps.

Over the full back-tested period, the S&P/TSX Composite High Dividend Growth Index posted a 7.2% annualized dividend growth rate, outpacing the S&P/TSX Composite Index’s 5.4% and the 2.6% CPI inflation rate. The index showed robust dividend growth well above inflation, which may lead to an increase in purchasing power over time.

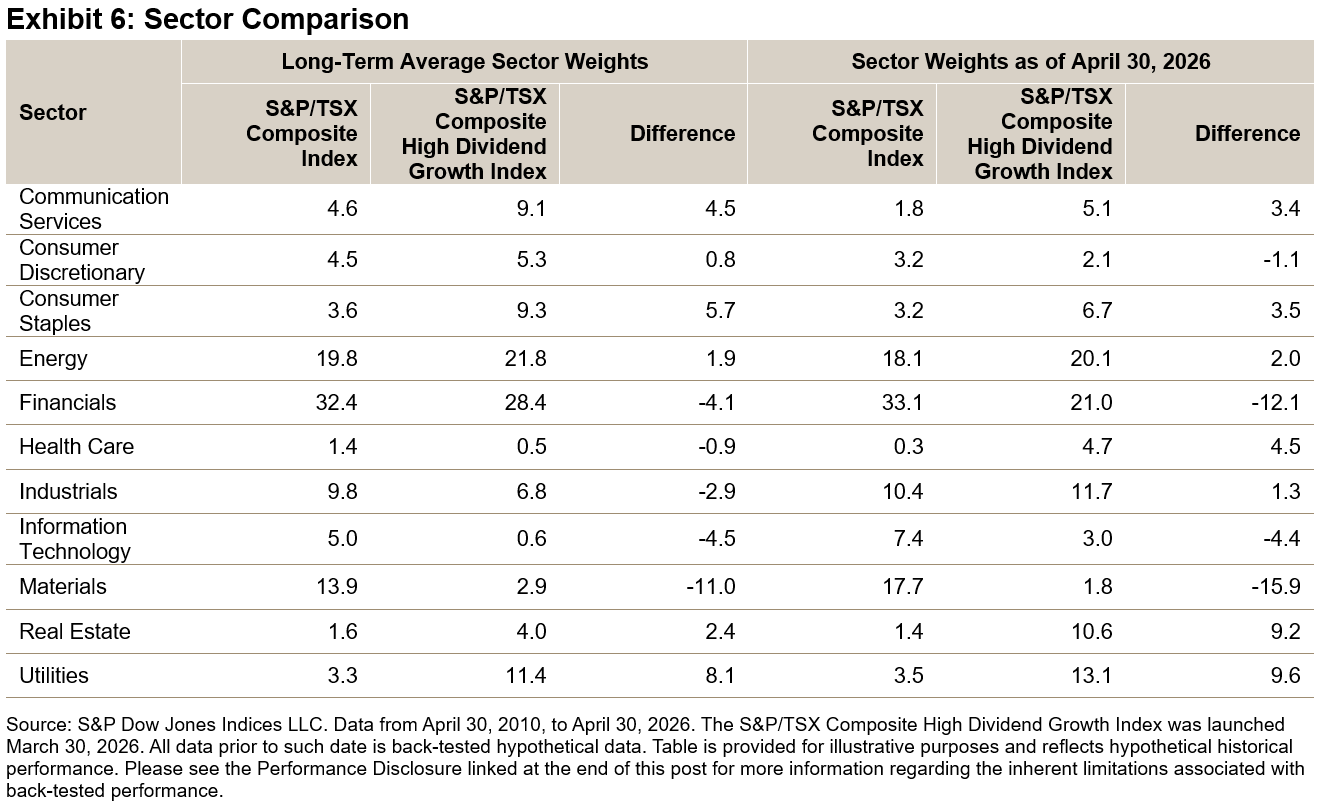
As of April 30, 2026, the S&P/TSX Composite High Dividend Growth Index is significantly overweight the Real Estate and Utilities sectors, while notably underweight in Financials and Materials. This weighting pattern is consistent with the long-term average, although current sector overweights and underweights are more pronounced than those seen over the long term.

Conclusion

S&P DJI is pleased to introduce this innovative methodology to the S&P/TSX Composite Index. With its distinctive approach, the index has shown outperformance and defensive characteristics, as well as higher dividend yield and growth relative to the S&P/TSX Composite Index over the back-tested period. The index serves as a new tool to track companies with a proven record of dividend growth, strong current dividend yields and projected future dividend growth.

1 See the S&P/TSX Canadian Indices Methodology for more information.

The posts on this blog are opinions, not advice. Please read our Disclaimers.

SPIVA Special Report: Heroes in Haystacks

Can Hero Funds save portfolios? S&P DJI’s Joe Nelesen takes a closer look at our special SPIVA report examining the performance of multi-asset portfolios of funds versus weighted blends of indices. 

The posts on this blog are opinions, not advice. Please read our Disclaimers.

S&P Momentum Indices Shine in April Rally

Contributor Image
Wenli Bill Hao

Director, Factors and Dividends Indices, Product Management and Development

S&P Dow Jones Indices

Momentum strategies, which tend to be known for performing well in trending markets, experienced a historically strong rebound in April. The S&P 500® Momentum Index, S&P MidCap 400® Momentum Index and S&P SmallCap 600® Momentum Index all posted double-digit gains, surpassing their respective benchmarks (see Exhibit 1). Notably, the April performance of the S&P 500 Momentum Index was the largest monthly gain since its inception in 1994.

In this blog, we will review the methodology, performance characteristics and attribution of the S&P Momentum Indices, with particular focus on the S&P 500 Momentum Index, S&P MidCap 400 Momentum Index and S&P SmallCap 600 Momentum Index.

Index Methodology

The S&P Momentum Indices typically utilize 12-month risk-adjusted price momentum to select stocks ranked in the top quintile of their eligible universes (see Exhibit 2).1 To account for short-term reversal effects, the most recent month is excluded when calculating price momentum.2 Employing risk-adjusted momentum instead of raw price momentum may help mitigate the negative impacts of idiosyncratic risk associated with raw momentum and can also reduce downside risks.3

The constituents of the S&P Momentum Indices are weighted by the product of their FMC and momentum score, subject to individual security and sector weight constraints. This approach effectively balances market weight with targeted factor exposure. The indices are rebalanced semiannually, with a 20% buffer rule to help reduce turnover.

A Short- and Long-Term View of Performance

Exhibit 3 demonstrates that all three S&P Momentum Indices have historically outperformed their respective benchmarks based on both absolute and risk-adjusted returns, in both the short and long term.

Over the past year, the S&P 500 Momentum Index, S&P MidCap 400 Momentum Index and S&P SmallCap 600 Momentum Index outperformed their benchmarks by 11.74%, 10.55% and 3.14%, respectively.

Furthermore, these indices have shown favorable capture ratios, delivering higher or similar gains during up markets4 and experiencing smaller declines during down markets.

Top Performance Contributors

Exhibit 4 highlights the top five contributors to the performance of these three S&P Momentum Indices over the one-year period ending April 30, 2026. Broadcom, Lumentum and TTM Technologies were the leading performers in the S&P 500 Momentum Index, S&P MidCap 400 Momentum Index and S&P SmallCap 600 Momentum Index, respectively.

Sectors

Exhibit 5 displays the active sector weights for the S&P Momentum Indices as of April 30, 2026. The S&P 500 Momentum Index overweighed the Information Technology sector by 14.01% relative to the S&P 500. Within the Information Technology sector, it was notably overweight in the Semiconductors and Semiconductor Equipment industry group by 20.61% and underweight in the Software and Services industry group by 7.29%. The S&P MidCap 400 Momentum Index and S&P SmallCap 600 Momentum Index held overweight positions of 15.92% and 5.97%, respectively, in the Industrials sector. All three indices exhibited large underweights in the Consumer Discretionary and Financials sectors.

Conclusion

The April rally underscored the resilience of the S&P Momentum Indices. Their strong performance, driven by a robust risk-adjusted methodology and favorable sector weights, highlights their potential as a systematic approach to reflecting market trends. With their historical outperformance, favorable capture ratios and disciplined rebalancing, these indices provide another tool for navigating the market.


1 Please refer to the S&P Momentum Indices Methodology for more details.

2 Jegadeesh, Narasimhan and Sheridan Titman, “Returns to Buying Winners and Selling Losers: Implications for Stock Market Efficiency,” The Journal of Finance, Vol. 48, No. 1, March 1993.

3 Fan, Minyou, Kearney Fearghal, Youwei Li and Jiadong Liu, “Momentum and the Cross-section of Stock Volatility,” Journal of Economic Dynamics and Control, Volume 144, November 2022.

4 The market is defined as the monthly performance of the underlying benchmarks from March 31, 1995, to April 30, 2026.


The posts on this blog are opinions, not advice. Please read our Disclaimers.

Beyond Mega Caps: Navigating Concentration and Diversification in Crypto Index Construction

Contributor Image
Felipe Diaz

Analyst, Global Exchanges & Digital Assets

S&P Dow Jones Indices

Cryptocurrency investing straddles two seemingly contradictory truths: market leadership changes fast, yet overall exposure remains dominated by a handful of top assets. From 2018 to 2025, Bitcoin and Ethereum—two mega caps¹—held a combined average weight of 78% in the S&P Cryptocurrency Broad Digital Asset (BDA) Index, while the top five constituents made up roughly 86% of the total index weight.

Outside that group, turnover has been notable: six of today’s top 10 assets in the S&P Cryptocurrency BDA Index either weren’t in the top 10 in 2017 or didn’t yet exist, and Bitcoin Cash’s weight collapsed from 9.4% to 0.5% over the same window.

Managing Turnover in a Fast-Moving Market

To reflect this shifting universe without excessive turnover, S&P DJI’s multi-coin strategies rebalance quarterly. For the S&P Top N Indices (targeting 5, 10, 20 or 30 constituents), a key design consideration is the 80/120 buffer rule built into the S&P Digital Assets Index Methodology: assets ranking in the top 80% of the target count are automatically included, while current constituents ranking within the top 120% receive priority for the remaining slots. This protects existing constituents from being swapped out due to the minor, short-term price fluctuations typical of crypto.

Choosing among Weighting Approaches

With the universe defined, market participants can select among indices ranging from market cap to equal weight. While some prefer cap weighting, others prefer equal weighting to give relatively greater representation to smaller cryptocurrencies.

Diversification, however, generally isn’t cost-free. The S&P Cryptocurrency Top 5 Equal Weight Index underperformed its cap-weighted benchmark by more than 14% annualized since March 2018 and showed higher volatility. While established equity factors (value, growth, quality) don’t yet cleanly translate to crypto, the result here is consistent with a size bias: equal weighting mechanically underweights mega caps and overweights altcoins, which tend to be smaller and more volatile. Altcoins have often rallied hardest during liquidity-driven runs (as seen during the 2021 and 2023 recoveries) and fallen hardest during drawdowns. In 2022, the S&P Cryptocurrency Top 5 Equal Weight Index suffered a 74% drawdown versus 66% for its cap-weighted counterpart.

As a middle ground, the S&P Cryptocurrency Top 20 Select 35/20 Capped Index caps the largest constituent at 35%, with all remaining constituents capped at 20%—a familiar traditional finance mechanism applied to crypto. Yet the cost of diversification is visible here too: over seven years, the capped version underperformed its uncapped benchmark by 9.6% annualized (34% versus 44%) with higher realized volatility (77% versus 71%).

Looking Ahead

Mega-cap dominance has historically rewarded concentrated, cap-weighted exposure—and because the cap-weighted S&P Cryptocurrency BDA Index has historically carried approximately 86% of its weight in its five largest assets, it has behaved in practice much like a mega-cap-tilted portfolio. Should maturing regulation and broader adoption erode that concentration, altcoins may play a larger role in index design, and structural differences may be seen across the Top 10, Top 20, and 35/20 capped strategies that imply changes in liquidity, volatility and risk.

¹ Mega caps here refer to Bitcoin and Ethereum, the only two assets to hold top two positions consistently since 2017.

The posts on this blog are opinions, not advice. Please read our Disclaimers.

Firewall as the Frontline

Contributor Image
Srineel Jalagani

Senior Director, Thematic Indices

S&P Dow Jones Indices

Cybercrime’s AI Moment

Cybersecurity has recently entered the crosshairs amid advances in AI. The preview of Claude Mythos has raised concerns among government and industry officials about its broader implications for an increasingly digital economy. That growth in digital commerce has brought cybercrime with it, exploiting the anonymity and borderless nature of the web to grow in both scale and sophistication. Estimated at USD 220 billion globally, cybersecurity spending is forecast to grow 13% annually, underscoring the sector’s rising importance as AI reshapes the threat landscape.

Tracking Cybersecurity: Construction and Performance

Given its significance to both today’s and tomorrow’s economy, Cyber Security is one of 25 themes within the S&P Kensho New Economies framework driving the Fourth Industrial Revolution. The S&P Kensho Cyber Security Index includes only companies whose primary business is cybersecurity, reflecting the sector’s depth and maturity.1

The S&P Kensho Cyber Security Index delivered a five-year annualized total return of 9%, in line with the S&P 500 Equal Weight Index, and outperformed it over the three-year period. A modified equal weighting methodology was chosen for the S&P Kensho Cyber Security Index to avoid the concentration risk that characterizes many technology-linked indices, and performance is therefore compared against equal-weighted benchmarks. Since peaking in October 2025 alongside the broader market, the index has churned to a flat YTD return and sits 13% below its historic high, as markets continue to weigh AI’s ultimate impact on the sector.

Dressed as Software, Built Like Defense

While cybersecurity is software by definition and closely correlated with Software & Services industry group, the segment makes a compelling case for greater resilience to AI disruption. Unlike much of the software world, cybersecurity spending is largely non-discretionary, underpinned by regulatory mandates that persist regardless of the economic cycle or technological change. Rather than a threat, AI may prove to be a catalyst. Expanding digital touchpoints widens the scope for malware attacks, driving demand for greater governance, compliance and protection. The net effect points to an expanding total addressable market for cybersecurity, with AI creating demand faster than it automates existing functions.

Cybersecurity and broader software indices have faced headwinds in recent months, while defense stocks have moved in the opposite direction, buoyed by rising geopolitical tensions. This divergence, however, may obscure a deeper connection, as governments across major economies now explicitly identify cybersecurity as a national security priority, blurring the line between digital and physical defense.2, 3, 4

Defense without Borders

Treating cybersecurity as an integral part of the broader security landscape, we track this theme through two complementary indices:

  • The S&P Kensho Future Security Index5 takes a forward-looking view, positioning Cyber Security alongside Space, Robotics, Drones and Wearables as the technologies defining the future of the security landscape.
  • The S&P Atlas Security, Defense, and Operational Support Index offers a ready-made group of constituents spanning the full security landscape across eight clusters, including Digital Security, Aerospace, Weaponry and Robotics, covering both established and emerging defense technologies. Constituents are selected globally using an AI/NLP framework developed by Theia Insights. The index forms part of the broader S&P Atlas Thematic Indices suite, designed to reflect both current and future drivers of a theme within a single diversified framework.

The S&P Kensho Future Security Index has delivered strong performance, posting a three-year annualized gain of 29%, slightly behind the S&P Aerospace & Defense Select Industry Index. The performance differential is partially attributed to the modified equal weight approach of the Kensho index relative to the float market cap weighting of the S&P Aerospace & Defense Select Industry Index.

The S&P Atlas Security, Defense, and Operational Support Index has taken a more balanced path over the same period, broadly tracking the defense theme while retaining cybersecurity as a core cluster. This reflects the blend of established defense and emerging security technologies that are included in the index.

Conclusion

Cybersecurity sits at a crossroads. AI has placed it under scrutiny as a software sector, yet simultaneously strengthened its case as a defense priority. As that tension plays out, the S&P Kensho Cyber Security Index, S&P Kensho Future Security Index and S&P Atlas Security, Defense, and Operational Support Index provide three ways to track this evolving theme, from pure-play cybersecurity to the full breadth of the modern security landscape.

1 The S&P Kensho Global Cyber Security Screened Index extends this benchmark to a global universe of companies, with an additional layer of sustainability-based eligibility criteria required for inclusion.

2 Shift in U.S. Cyber Strategy: What the White House’s New Offensive Cyber Posture Signals for Businesses. Baker Donelson. March 10, 2026.

3 NIS2 Directive: securing network and information systems, European Comission.

4 Outline of the Cybersecurity Strategy. National Cybersecurity Office, Japan. Dec. 23, 2025.

5 The S&P Kensho Global Future Defense Index extends this benchmark to a global universe of companies.

The posts on this blog are opinions, not advice. Please read our Disclaimers.