As market volatility continues in the U.S., the Dow Jones U.S. Dividend 100 Index and Dow Jones International Dividend 100 Index have emerged as standout performers. Year-to-date (YTD) as of Feb. 28, 2026, both indices have posted double-digit gains (see Exhibit 1).
Notably, the Dow Jones U.S. Dividend 100 Index has outperformed its benchmark universe by 14.81% YTD. This outperformance has largely been driven by its overweights in the Energy and Consumer Staples sectors, as well as its underweight in Information Technology. The index’s top four holdings—Lockheed Martin, ConocoPhillips, Verizon and Chevron—have each posted returns exceeding 20% in 2025, helping drive index-level performance.
In this blog, we will examine their index methodology, historical performance and key characteristics.

Methodology Overview
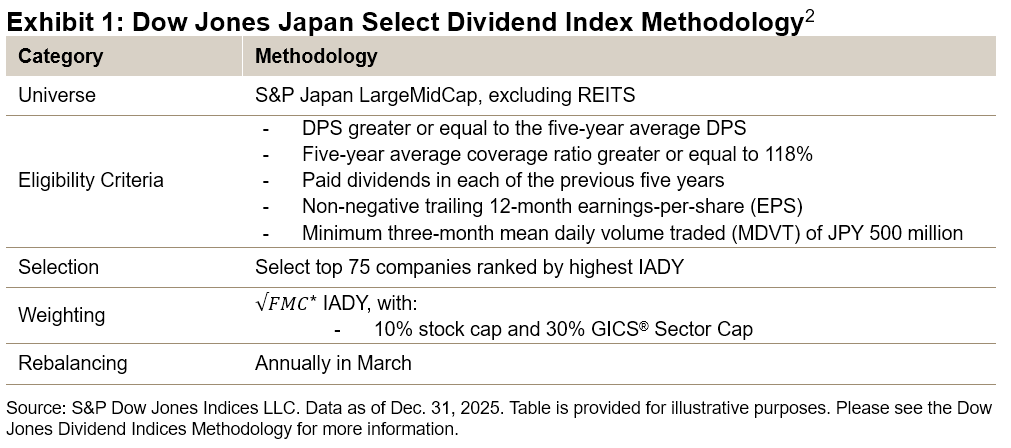
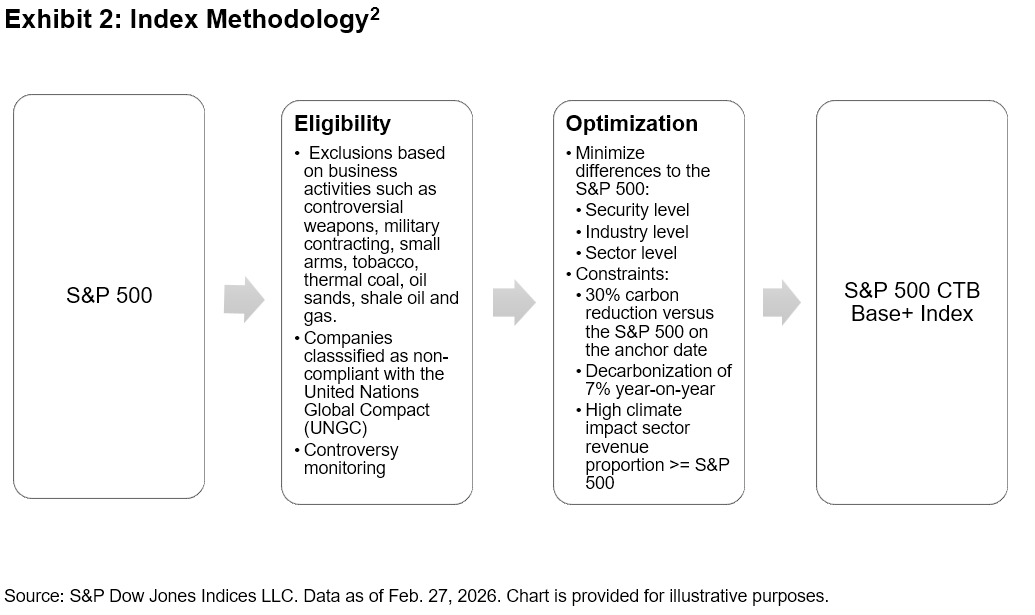
What differentiates the Dow Jones Dividend 100 Indices—and has contributed to their long-term outperformance—is their emphasis on dividend consistency combined with a multi-factor selection process that blends two dividend metrics with two quality measures. The methodology begins by excluding companies that have not paid dividends for at least 10 consecutive years. Next, eligible stocks are ranked by their indicated annualized dividend (IAD) yield, with those falling below the median IAD yield removed (see Exhibit 2).
From the remaining pool, the top 100 companies are selected based on a composite score that combines the following four factors: free cash flow to total debt, return on equity, IAD yield and five-year dividend growth rate. For the Dow Jones International Dividend 100 Index, an additional screen is applied, removing the bottom half of stocks with the highest three-year price volatility before final selection.2
The selected constituents are weighted by capped float-adjusted market capitalization, with stock and sector caps in place that aim to reduce concentration risk and enhance diversification.

Performance History
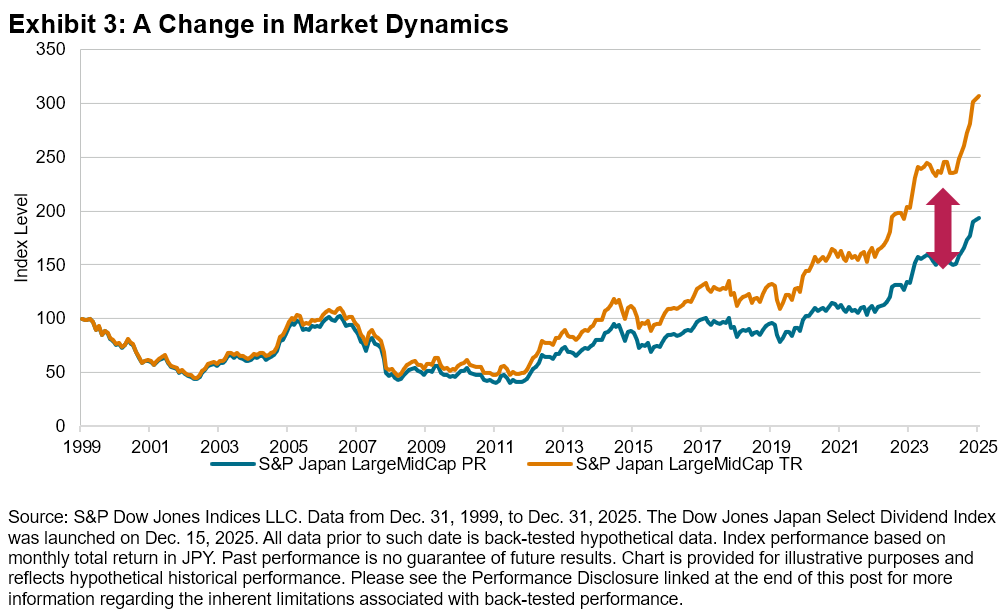
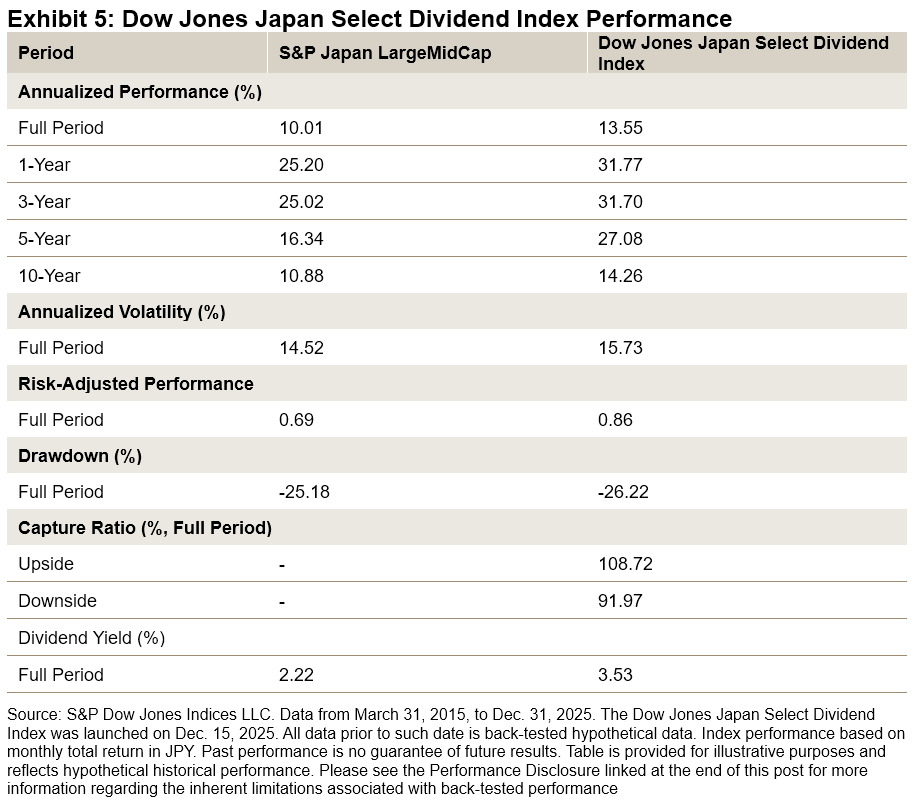
Over the long term, including back-tested results, the Dow Jones Dividend 100 Indices have outperformed their benchmark universes, both in absolute total return and risk-adjusted terms. The Dow Jones International Dividend 100 Index has outperformed over short-, medium- and long-term horizons. Similarly, the Dow Jones U.S. Dividend 100 Index has outperformed across both short- and long-term periods.
In addition to outperformance, both indices have exhibited lower risk and reduced drawdowns compared to their benchmark universes (see Exhibit 3).

Enhanced Dividend Yield and Dividend Growth
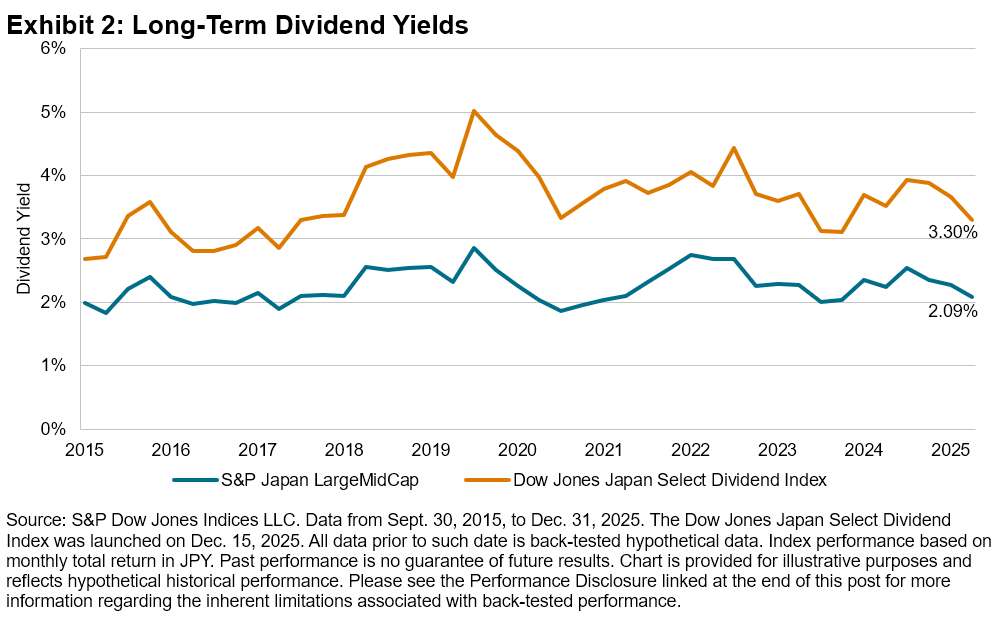
The Dow Jones Dividend 100 Indices have consistently posted higher dividend yields compared to their respective benchmarks (see Exhibit 4). Over the period from Dec. 31, 2006, to Dec. 31, 2025, the Dow Jones U.S. Dividend 100 Index averaged a yield of 3.82%, significantly higher than the 1.75% yield of the Dow Jones U.S. Broad Stock Market Index. Similarly, the Dow Jones International Dividend 100 Index posted an average yield of 4.42%, outperforming the Dow Jones Global ex-U.S. Index, which averaged 2.99%.

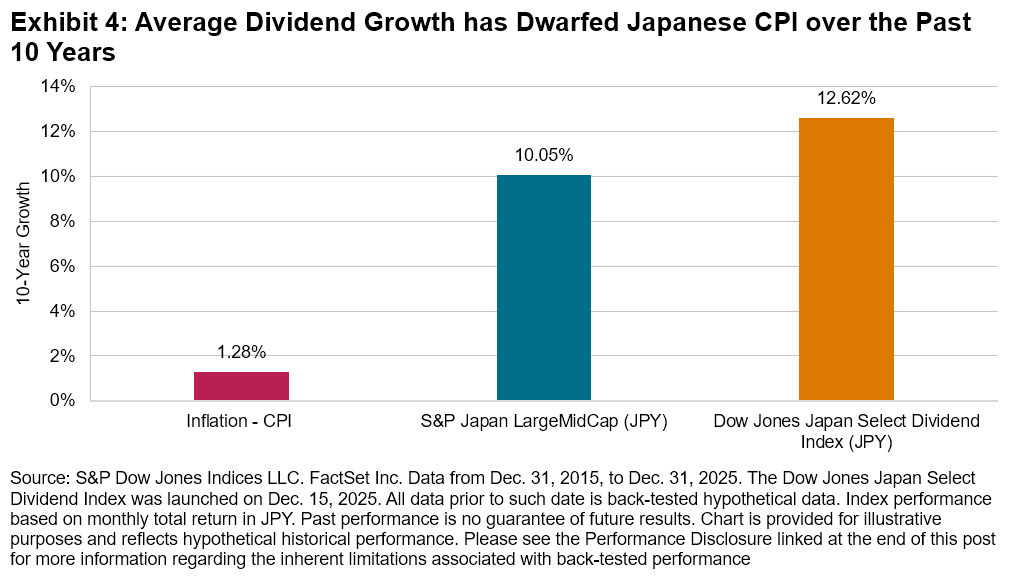
By prioritizing dividend growth, strong fundamentals and high yield as primary selection criteria, the indices also posted significantly higher dividend growth rates than their respective benchmark universes over the 10-year period from Dec. 31, 2015, to Dec. 31, 2025. Importantly, these elevated dividend growth rates have historically outpaced long-term inflation rates in their respective markets, providing a potential hedge against inflation and helping to preserve purchasing power over time.

Quality and Value Tilts
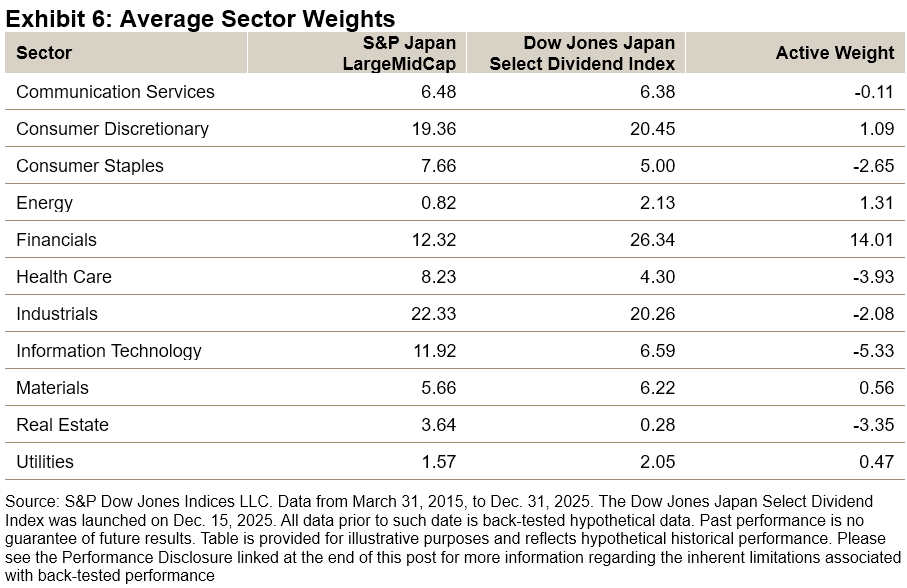
The Dow Jones Dividend 100 Indices have tended to exhibit favorable value and quality characteristics relative to their respective benchmarks (see Exhibit 6). In valuation terms, as of Feb. 28, 2026, both dividend indices are trading at a discount relative to their respective benchmarks, while exhibiting comparable or higher profitability.

Conclusion
The Dow Jones U.S. Dividend 100 Index and Dow Jones International Dividend 100 Index have shown sustained dividend payment and dividend growth historically. From March 31, 2005, to Feb. 28, 2026, including back-tested analysis, they have outperformed their respective benchmarks in both absolute and risk-adjusted terms, while exhibiting lower risk and drawdowns. Furthermore, their distinct quality and value characteristics—such as higher profitability and discounted valuations—may help market participants navigate changing market conditions with greater confidence.
1 For the Dow Jones International Dividend 100 Index, we note we use the Dow Jones Global ex-U.S. Index as its benchmark comparison, as it also includes small-cap constituents, while its universe indices are the Dow Jones Global ex-U.S. Large-Cap and Dow Jones Global ex-U.S. Mid-Cap.
2 Please refer to the methodology of the Dow Jones Dividend 100 Indices for more details.
The posts on this blog are opinions, not advice. Please read our Disclaimers.