Categories
Fixed Income Sustainability

How to Bring Paris Agreement Goals to Fixed Income Indices

This blog was co-authored by Smadar Shulman and Paulina Lichwa-Garcia.

As the transition to net zero is becoming a critical consideration in portfolio management, the popularity of indices that incorporate the EU’s minimum standards for Climate Transition Benchmarks (CTBs) and Paris-aligned Benchmarks (PABs) has been gathering pace. Such benchmarks aim to select securities that are collectively compatible with a lower carbon economy.

What Are EU PABs and CTBs?

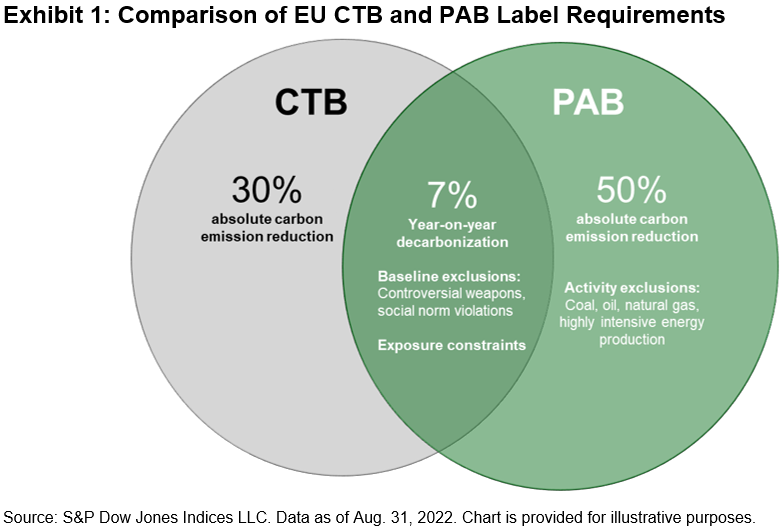
The EU has defined a regulatory framework with minimum standards for benchmarks labeled PAB and CTB1 in line with the goals of the Paris Agreement and net zero by 2050. These are similar in their year-on-year decarbonization trajectories but differ in the greenhouse gas (GHG) emissions reductions and business activity exclusions. Exhibit 1 illustrates their similarities and differences.
Application of the S&P PACT to Fixed Income indices

While the blueprint regulation provides minimum standards, there are additional elements relevant for fixed income investors to consider. This includes methodology design, application to a fixed income universe and further consideration of climate-related risk factors.

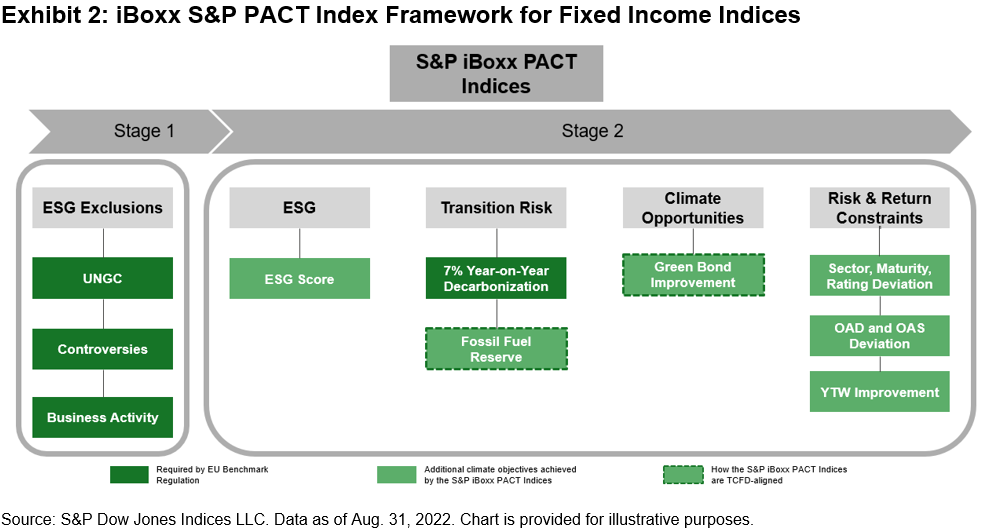
The recently launched iBoxx EUR Corporates Net Zero 2050 Paris-Aligned ESG expands the suite of S&P PACT Indices (S&P Paris-Aligned & Climate Transition Indices) into fixed income. The index is based on the broad iBoxx € Corporates, covering investment grade euro-denominated corporate bonds, and takes into consideration not only the EU minimum standards for PABs, but also other factors such as transition risk, climate opportunities, ESG score overlay and fixed income risk and return profiling constraints.

The iBoxx EUR Corporates Net Zero 2050 Paris-Aligned ESG offers a differentiated solution for fixed income investors seeking a bond benchmark that incorporates the goals of the Paris Agreement that:

  • Aims to meet or exceed the EU’s minimum standards for PABs;
  • Leverages multiple ESG data sources, utilizing screening and optimization to determine climate index constituents and weights;
  • Incorporates factors that seek to manage transition risk and climate change opportunities, in alignment with the recommendations of the Financial Stability Board’s Task Force on Climate-related Financial Disclosures (TCFD);
  • Offers a broad exposure while aiming to efficiently track the underlying index (iBoxx € Corporates) and minimize turnover; and
  • Improves the ESG score against the underlying universe.

In addition to the required decarbonization trajectory (using Scopes 1, 2 and 3 GHG emissions data) and a minimum set of exclusions, the index also excludes companies involved in fossil fuel operations and power generation. Furthermore, the index seeks to reduce companies’ fossil fuel reserves emissions exposure versus the underlying index, which is considered a more forward-looking measure than historical GHG emissions. Both transition risks are based on S&P Global Trucost ESG and climate data. The ESG overlay exceeds the EU’s minimum standards by aiming for ESG score2 improvement against its underlying index universe.

Going beyond the EU’s minimum standards, the index also aims to track the underlying index efficiently by design, minimizing turnover and including fixed income constraints (e.g., on yield, duration, maturity and rating).

In terms of climate opportunities, the index apportions a higher weight to green bonds,3 reflecting the opportunity embedded in such issuance.
Index Profile: iBoxx EUR Corporates Net Zero 2050 Paris-Aligned ESG

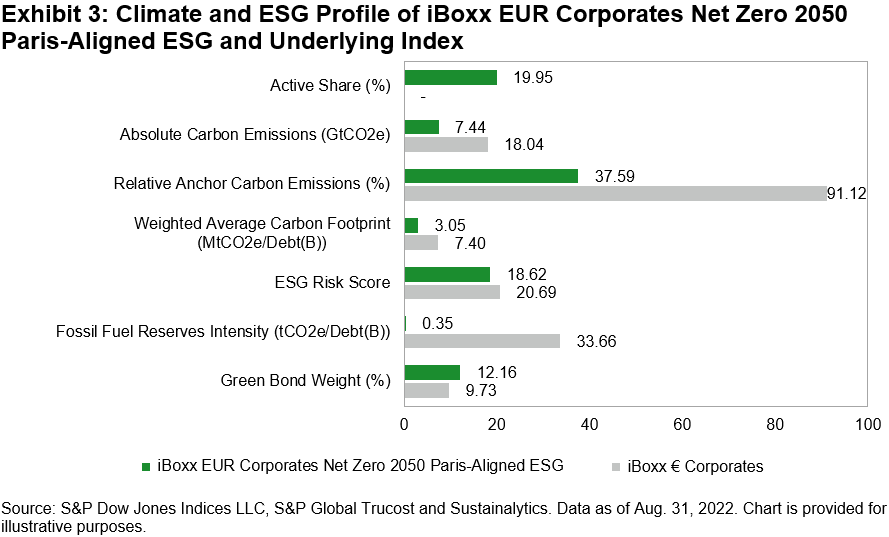
Comparing the iBoxx EUR Corporates Net Zero 2050 Paris-Aligned ESG with its underlying index, Exhibit 3 illustrates the sustainability-related improvements.
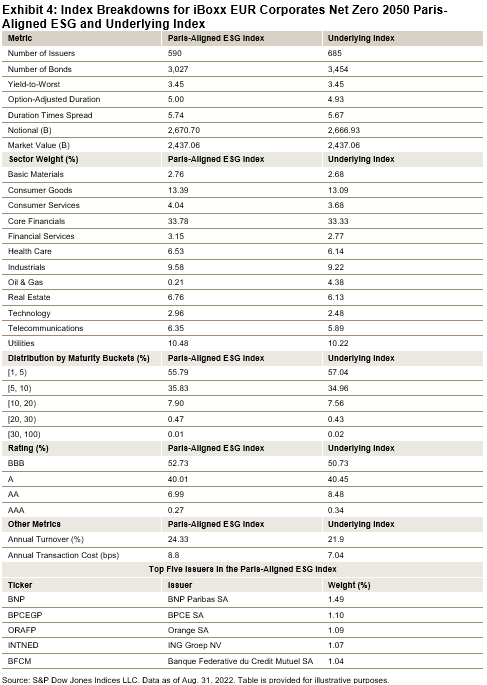
Going deeper, Exhibit 4 shows a comparison of key metrics and breakdowns by sector, maturity and rating.
Conclusion

At the core, the iBoxx EUR Corporates Net Zero 2050 Paris-Aligned ESG has a simple goal of providing an indexing solution for products seeking to divert capital into investments aligned with the net zero 2050 pathway. But as a solution to a complex problem, it incorporates multi-layer considerations in a rules-based way. The iBoxx EUR Corporates Net Zero 2050 Paris-Aligned ESG seeks to achieve and exceed the EU’s minimum standards while also building in considerations for ESG, climate risk-related factors and fixed income-related risk/return profiling while closely tracking the underlying benchmark.

1 Regulation (EU) 2019/2089 of the European Parliament and of the Council of 27 November 2019 amending Regulation (EU) 2016/1011 as regards EU Climate Transition Benchmarks. EU Paris-aligned Benchmarks and sustainability-related disclosures for benchmarks. https://eur-lex.europa.eu/legal-content/EN/TXT/PDF/?uri=CELEX:32019R2089&from=EN

2 ESG score is sourced from Sustainalytics research.

3 These are broadly based on the International Capital Market Association’s (ICMA) voluntary Green Bond Principles, which require a Use of Proceeds (UoP) commitment for green projects: https://www.icmagroup.org/sustainable-finance/the-principles-guidelines-and-handbooks/green-bond-principles-gbp/


Categories
Sustainability

The S&P PACT Indices: Leading the Net Zero Charge for Two Years

Two years is a long time in the sphere of ESG. While the world wrestled with the worst pandemic in a century, S&P Dow Jones Indices (S&P DJI) shook the ESG indexing space and cemented its position as a leader in climate indices. April 20, 2022, marks the two-year anniversary of the launch of the first of the S&P PACT™ Indices (S&P Paris-Aligned & Climate Transition Indices), which aim to align with a 1.5⁰C scenario, the EU’s minimum standards for Climate Transition Benchmarks (CTBs) and Paris-aligned Benchmarks (PABs) and the recommendations of the Task Force on Climate-related Financial Disclosures (TCFD). Furthermore, the S&P PACT Indices go beyond the EU’s minimum standards for CTBs and PABs by using pioneering, forward-looking carbon and physical risk data provided by S&P Global Trucost, as well as incorporating Science Based Targets (SBTi) in its approach.

Exhibit 1 shows how the index series has changed since its launch, including expansion into new regions and index construction consultations, adapting to an ever-evolving sustainable investing landscape.

Performance Metrics

All S&P PACT Indices are designed to uphold their climate-related objectives while maintaining a similar sector and industry composition to their benchmarks, minimizing active risk. These objectives have held up well, as we can see in Exhibit 2, with each S&P PACT Index having stayed broadly close to its respective benchmark in terms of risk and return.

In fact, we see that most S&P PACT Indices have outperformed their market-cap-weighted underlying benchmarks over their history. Exhibits 3 display the S&P PACT Indices’ resilience to the market downturn during the pandemic, while the recent underperformance in 2022 coincides with the price surge in Energy stocks, which tend to be underweighted or excluded from each index (see our paper Exploring S&P PACT Indices Weight Attribution for further details).

Carbon Reduction

As reflected in the S&P PACT Index Methodology, one of the main requirements of the EU’s minimum standards for CTBs and PABs is the 7% year-over-year reduction in carbon intensity, a key component in staying aligned with a 1.5⁰C scenario. The use of the S&P Global Trucost Transition Pathway Model is a powerful way to help ensure each index within the S&P PACT Index Series aligns with a 1.5⁰C greenhouse gas (GHG) emission reduction pathway. The S&P Global Trucost Transition Pathway Model compares each S&P PACT Index constituent’s GHG emissions with its 1.5⁰C-aligned carbon budget, utilizing both forward- and backward-looking carbon data.

Exhibit 4 shows how S&P DJI’s sophisticated approach to the construction of the S&P PACT Indices has resulted in significantly improved carbon metrics relative to their benchmarks, going beyond the minimum standards set out by the EU PABs and CTBs.

Similarly, the S&P PACT Indices showed improvements in overall ESG performance (as measured by their S&P DJI ESG Score) relative to their market-cap-weighted benchmarks, as seen in Exhibit 5.

To conclude, despite significant uncertainty in global markets and geopolitics since their inception two years ago, the S&P PACT Indices have demonstrated their value by maintaining benchmark-like performance while meeting stringent climate objectives and aligning with a 1.5⁰C scenario. For an index focused on the long term, it doesn’t look half bad in the short term.

For further information on our net zero index solutions, please see here.

1 For the latest S&P PACT Index education piece, please see here.

2 For more on the first consultation, methodology changes, further exclusions and their effects on the indices, please see here.

3 For more on the second consultation, methodology changes, country and sector neutrality and their effects on the indices, please see here.

Categories
Sustainability Thematics

The S&P Eurozone Paris-Aligned Climate Index Concept: Implementing the Proposed EU Climate Benchmark Regulation

Introduction

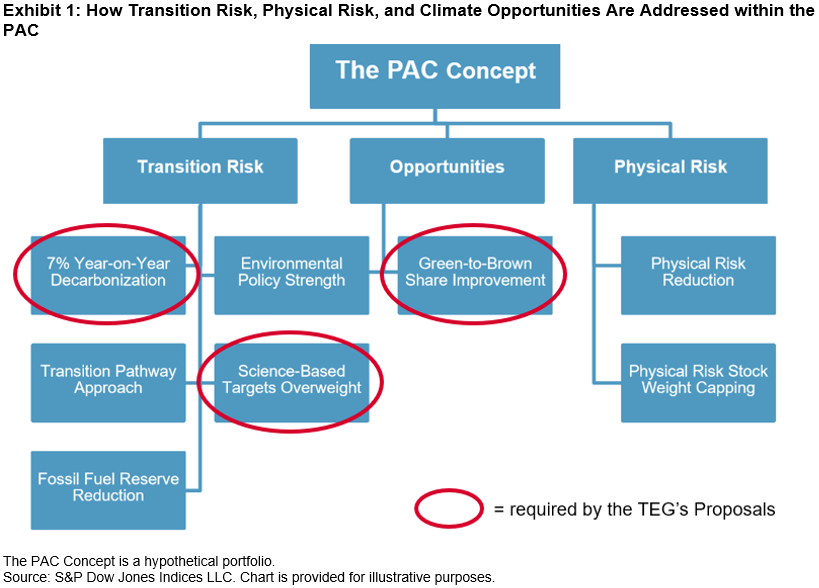
In January 2020, S&P Dow Jones Indices (S&P DJI) released a paper for the S&P Eurozone Paris-Aligned Climate Index Concept (PAC Concept).  The PAC Concept conceptualizes the proposals of the EU Technical Expert Group on Sustainable Finance (TEG), as published in its Final Report on Climate Benchmarks and Benchmarks’ ESG Disclosure dated September 2019,[1] for the Paris-aligned benchmark and incorporates transition risk, physical risk, and climate opportunities, as laid out by the TCFD[2] (see Exhibit 1).  The PAC Concept implements innovative and forward-looking Trucost[3] datasets: physical risk and the transition pathway approach.  This blog outlines two methods, which the PAC Concept applies to meet the TEG’s proposals.

7% Year-on-Year Decarbonization

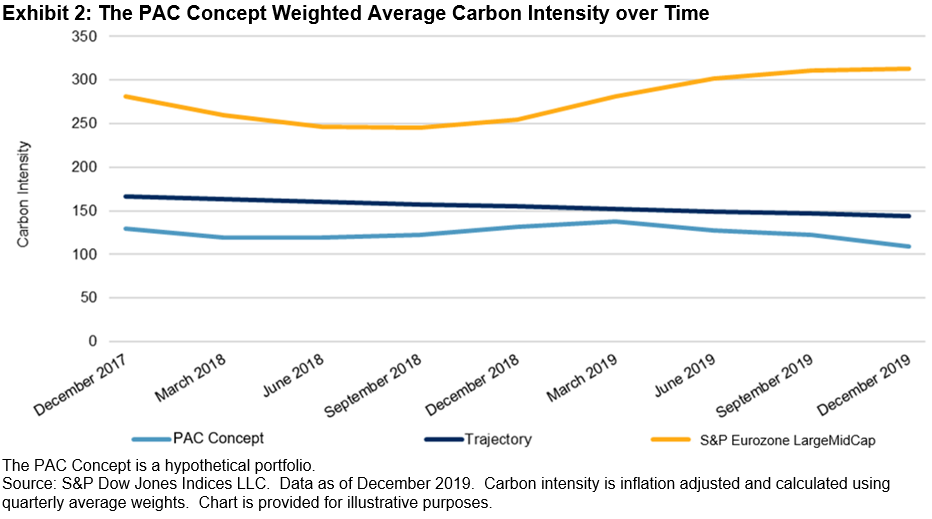
To align with the TEG’s proposals for the Paris-aligned benchmark, a 50% carbon footprint reduction and decarbonization[4] by 7% year-on-year are required. Complexity lies in the 7% year-on-year decarbonization: this must occur not only at rebalance but also when calculated using average weights over the period. Consequently, as weights drift between rebalances, the carbon footprint must stay below the 7% year-on-year trajectory on average. Therefore, the PAC Concept’s trajectory targets 5% below the required level of decarbonization and is rebalanced quarterly.  This allows for intra-rebalance weight fluctuations, while remaining compliant.

The middle line in Exhibit 2 shows the required 7% year-on-year decarbonization, the yellow line represents the carbon intensity of the parent index, and the bottom line the PAC Concept’s carbon intensity, measured using average weights.[5] Over the period, the parent index’s carbon intensity decreases then increases—a good methodology test for the PAC Concept.  The PAC Concept’s carbon intensity starts to increase toward the trajectory line; however, at rebalance the index’s decarbonization buffer[6] forces it below required carbon intensity.

Exclusions

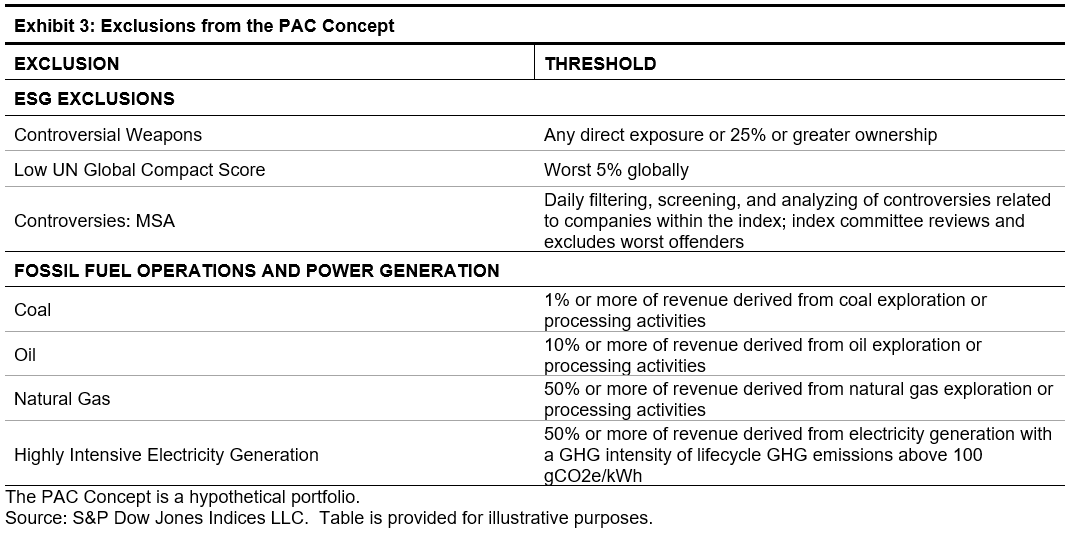
The TEG’s proposals also require certain exclusions. These exclusions are based on:

  • Controversial weapons;
  • Societal norms (which the PAC Concept tackles through the use of UN Global Compact exclusions);
  • Severe controversies surrounding environmental issues (the PAC Concept excludes severe controversies in all areas of ESG);
  • Coal exposure;
  • Oil exposure;
  • Natural gas exposure; and
  • Highly intensive electricity generation.

Exhibit 3 outlines the exclusions that have been implemented.

Please refer to the PAC concept paper for further details.

[1]   The EU Technical Expert Group on Sustainable Finance Final Report on Climate Benchmarks and Benchmarks’ ESG Disclosure, September 2019. The final report will serve as the basis for the European Commission for the drafting of the delegated acts under Regulation 2019/2089.

[2]   TCFD. (2017). Final Report: Recommendations of the Taskforce on Climate Related Financial Disclosures.

[3]   A part of S&P Global.

[4]   Decarbonization refers to the reduction of an index’s carbon footprint.

[5]   As advised by the TEG.

[6]   The buffer is referring to targeting below the 7% year-on-year trajectory line.