How are indices bringing greater transparency to Saudi Arabia’s sukuk and fixed income markets? S&P DJI’s Jessica Tan joins GCMA’s Michael Grifferty for a closer look at the trends driving the evolution of these markets and how index-based tools are helping market participants evaluate the region’s opportunity set.
The posts on this blog are opinions, not advice. Please read our Disclaimers.Understanding the iBoxx Tadawul SAR Indices
What’s beyond the Top 60 in Canada?
S&P 500 in Focus: Global Trends and Local Insights
Spot the Difference
S&P High Yield Dividend Aristocrats Expands with Eight New Members in the Latest Reconstitution
Understanding the iBoxx Tadawul SAR Indices
What’s beyond the Top 60 in Canada?

- Categories Equities
- Tags Canada, Canada FA, Canadian Equity, S&P/TSX Completion
Canada’s investment landscape is often defined by the S&P/TSX 60, the benchmark that comprises the nation’s largest companies. These larger-cap companies—predominantly Financials and Energy firms—tend to lead headlines for portfolio allocations. Yet beneath the top tier of widely recognized names exists a dynamic segment that focuses on emerging leadership, innovation and diversification in Canada’s public markets.
The group of companies ranked just outside the flagship S&P/TSX 60—referred to here as the “Next 40”—reflect an important segment with the potential to transition to the S&P/TSX 60. This group represents a blend of mid-sized companies and emerging smaller caps with high potential, making the Next 40 a potential signal for the direction of the Canadian economy.
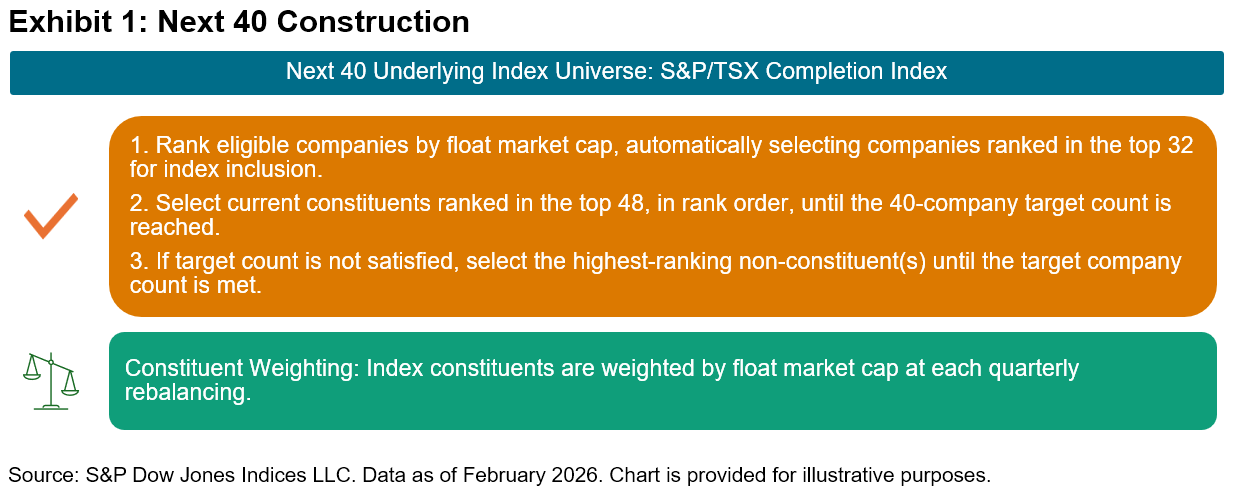
The Next 40 consists of the 40 largest constituents of the S&P/TSX Completion Index. Rebalancing quarterly on the third Friday of March, June, September and December, this basket maintains strict modularity with the flagship S&P/TSX 60. To preserve the distinction, any constituent added to the S&P/TSX 60 is removed from the Next 40 on an intra-quarter basis and replaced, ensuring no overlap between the two tiers.
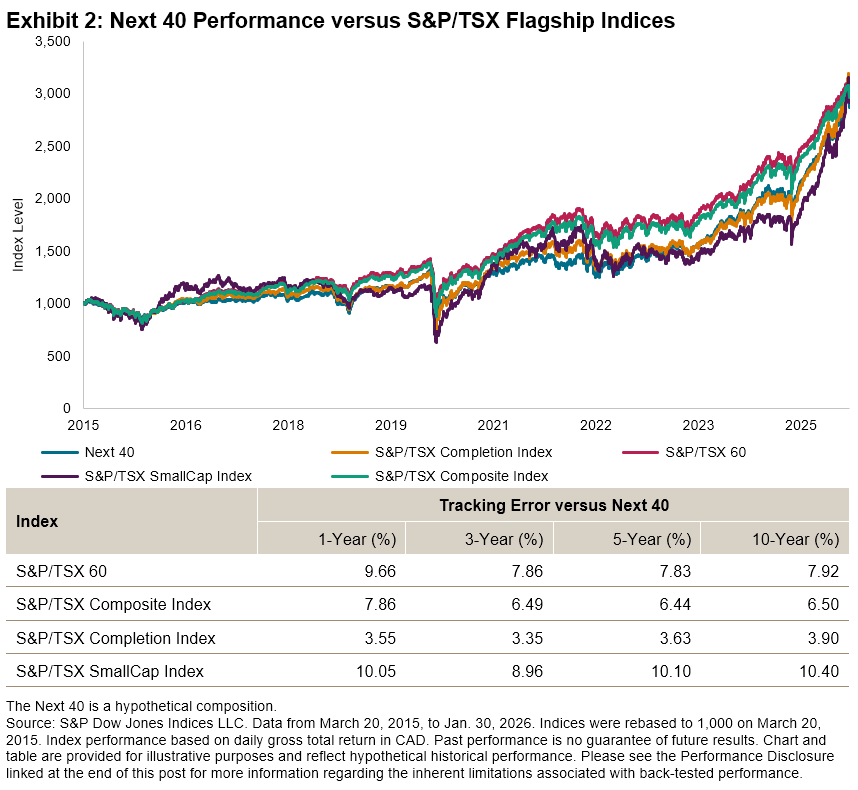
Over the period studied, the Next 40 tracked most closely to the S&P/TSX Completion Index, while also remaining competitive with the flagship S&P/TSX 60 and the broader S&P/TSX Composite Index (see Exhibit 2). Specifically, the Next 40 maintained a tracking error above 7% against the large-cap flagship, demonstrating that it was measuring a distinct market segment rather than acting as a redundant proxy. By contrast, its lower tracking error against the S&P/TSX Completion Index shows that it has historically been a reliable representation of the market, avoiding the unpredictability often found in smaller, less liquid stocks.
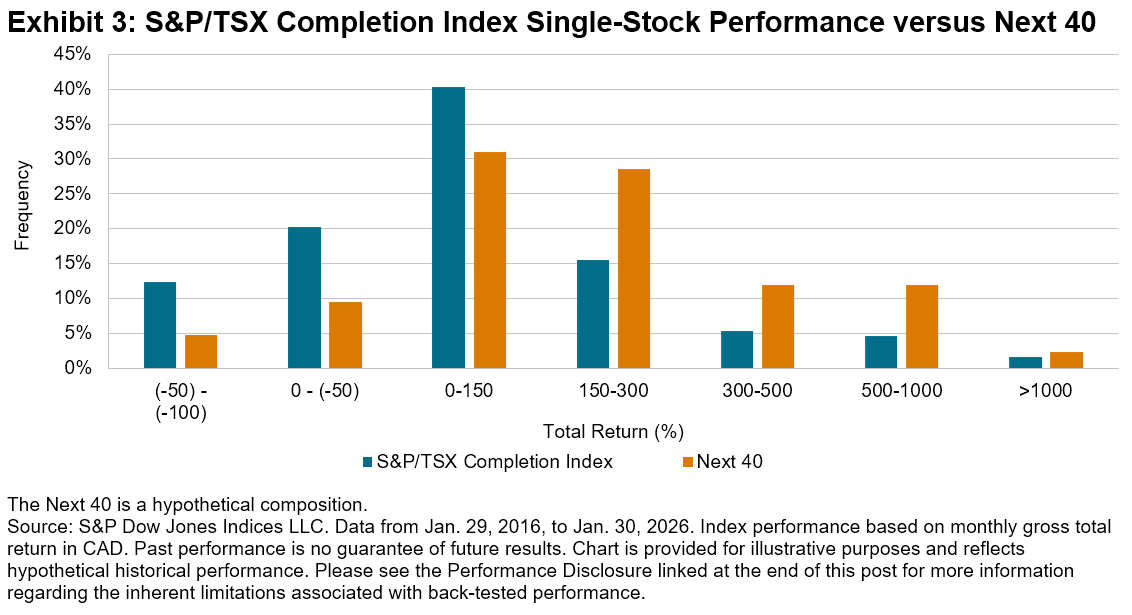
While the Next 40 tracked closely to the S&P/TSX Completion Index, it can act as a strategic filter that narrows the universe down to its most impactful stocks. By omitting smaller constituents that have historically underperformed, the Next 40 could serve as a more efficient version of the S&P/TSX Completion Index, focusing on how specific names tended to perform better than their peers over the 10-year period reflected in Exhibit 2. As shown in Exhibit 3, this refinement allowed the components in this statistic to populate the top-tier brackets—specifically those with a total return exceeding 150%—more consistently than the broader universe.
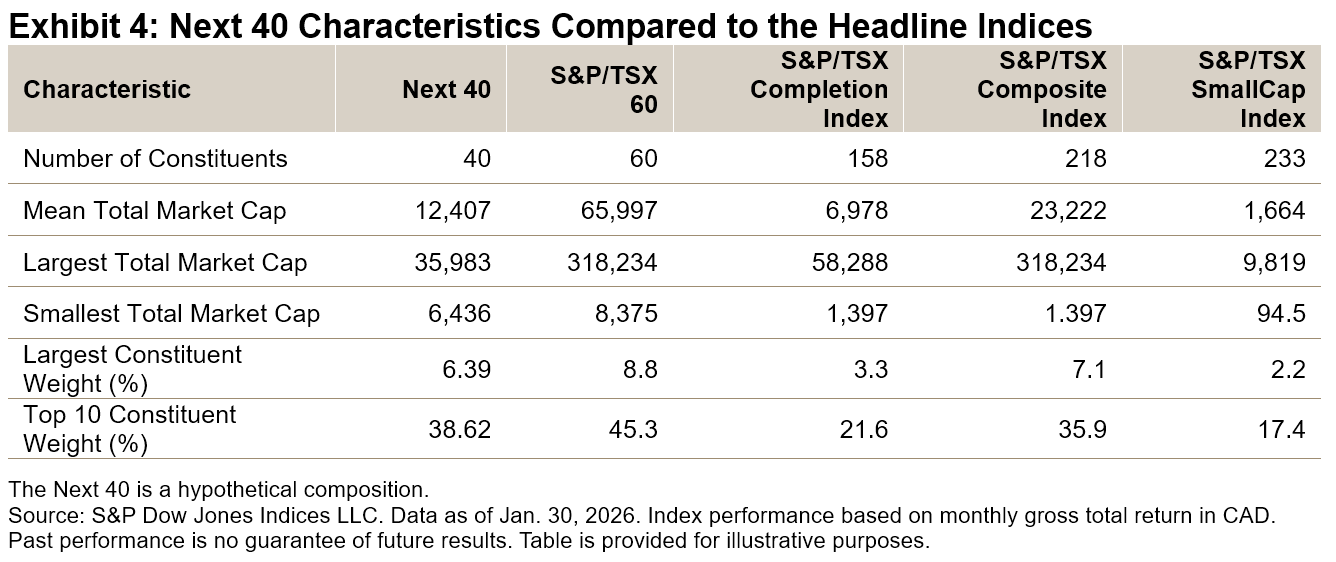
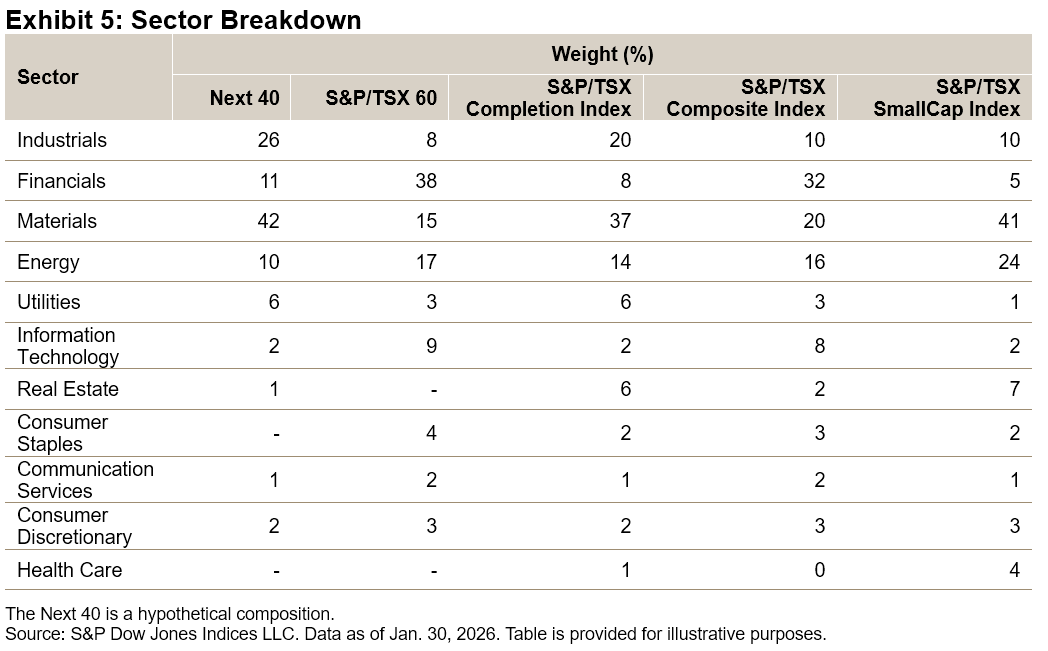
While the S&P/TSX 60 tends to be characterized by heavy concentration in mega-cap entities, the Next 40 has tended to have more balanced weights, with the largest constituent holding a weight of only 6.39% (see Exhibit 4). This differentiation is further supported by the varied sector contribution over the years (see Exhibit 5). While Financials remained a core pillar, sectors like Industrials and Materials have gained meaningful participation as well.
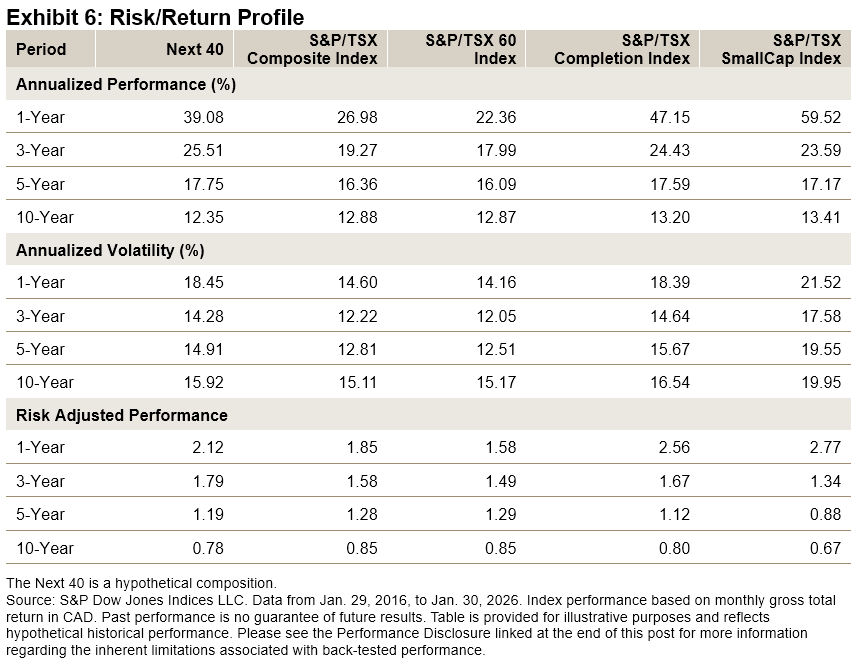
The Next 40 represents a compromise between size stability and growth dynamism. Over the 10-year period, the S&P/TSX Composite Index and the S&P/TSX 60 had high annualized returns. The Next 40 had only slightly higher volatility than the S&P/TSX 60, which reinforces its focus on the largest, most established firms outside of the traditional top tier.
Conclusion
The Next 40 is more than just an overflow list: it’s an indicator of the more liquid mid-cap segment of Canadian equities. By moving beyond the mega-cap concentration of the S&P/TSX 60, the Next 40 reduces focus on a handful of giants by seeking innovation in sectors that tend to be under-represented in the top tier. For a broader perspective on Canadian equities, incorporating a structured view of these firms may provide a fresh lens into where growth and innovation may emerge.
The author would like to thank Tom Phillips for producing analysis and data underlying this post.
The posts on this blog are opinions, not advice. Please read our Disclaimers.
S&P 500 in Focus: Global Trends and Local Insights
How is the continued evolution of the S&P 500 ecosystem helping market participants around the globe express views and manage risk? S&P DJI’s Tim Edwards and Cboe Global Markets’ Mandy Xu explore how the iconic index reflects global trends and how network effects are helping bring increased transparency and price efficiency to markets around the world.
The posts on this blog are opinions, not advice. Please read our Disclaimers.Spot the Difference

From a U.S. equities perspective, the first month of 2026 started on a different trajectory compared to years past. S&P 500® performance trailed much of the rest of the world (as measured by the S&P World Ex-U.S. Index), and within the U.S., the performance of the S&P 500 Information Technology (“U.S. Tech”) ranked in the bottom half among all 11 GICS® sectors. Fears of trade tensions tied to geopolitics, rising worries of an AI bubble and tepid economic datapoints dragged on overall market performance, with The 500® falling for much of the month before finishing up 1.5%, while U.S. Tech fell 1.7%.
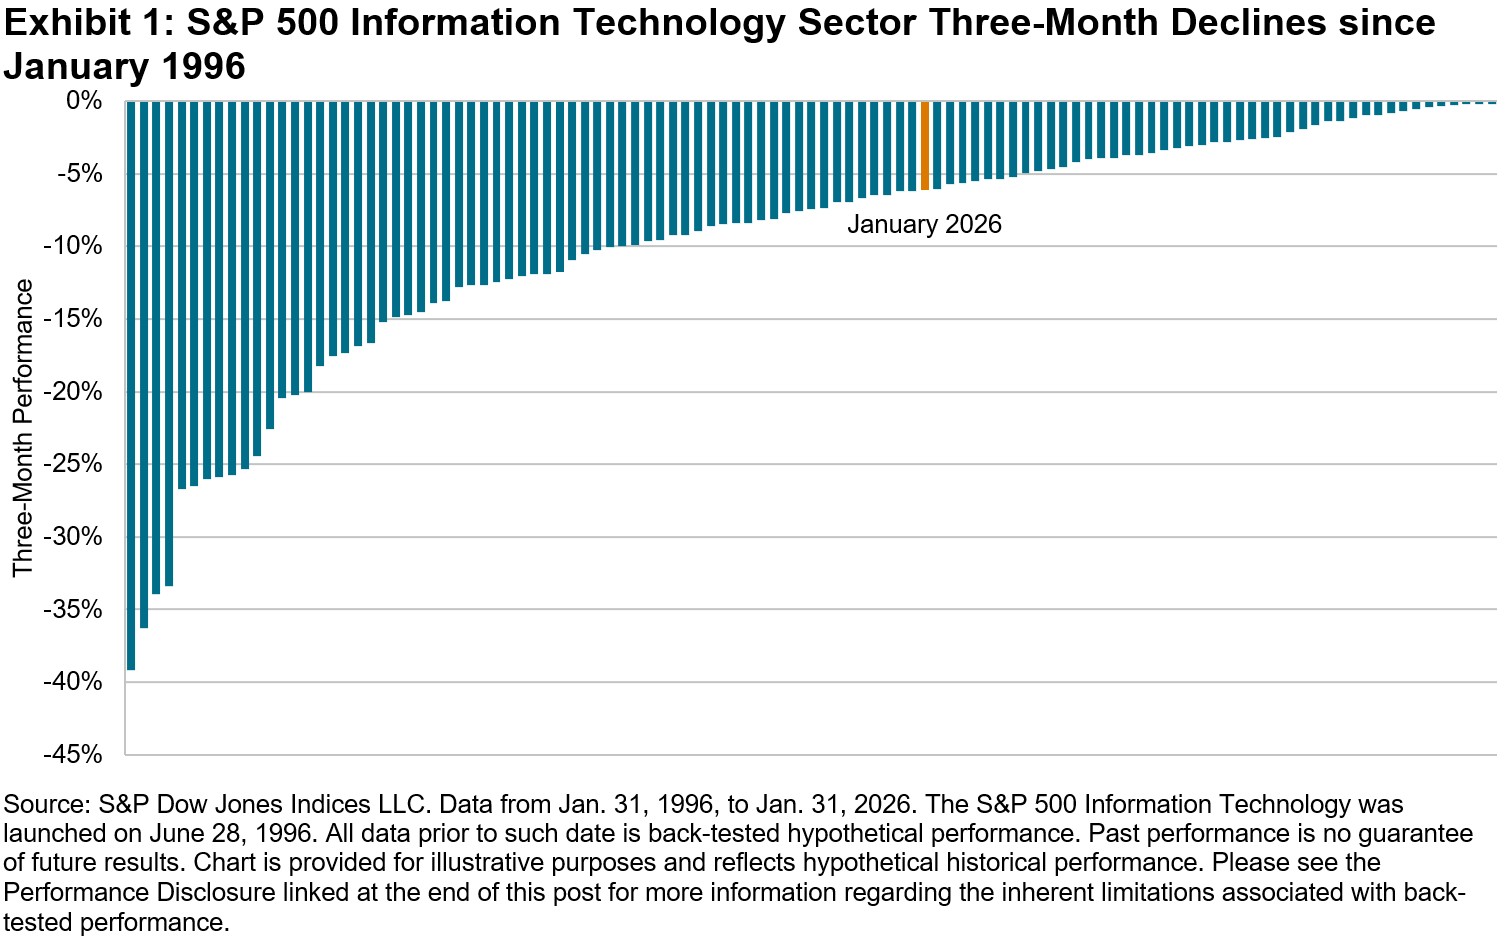
It was just over three months prior that U.S. Tech had reached an all-time high in October 2025, before sliding down 6.1% over the three months ending in January. U.S. Tech’s latest decline is noteworthy, but certainly not unprecedented, as the sector produced negative three-month performance 109 times over the last 30 years, with more than half of those periods even worse than January’s result, as shown in Exhibit 1.
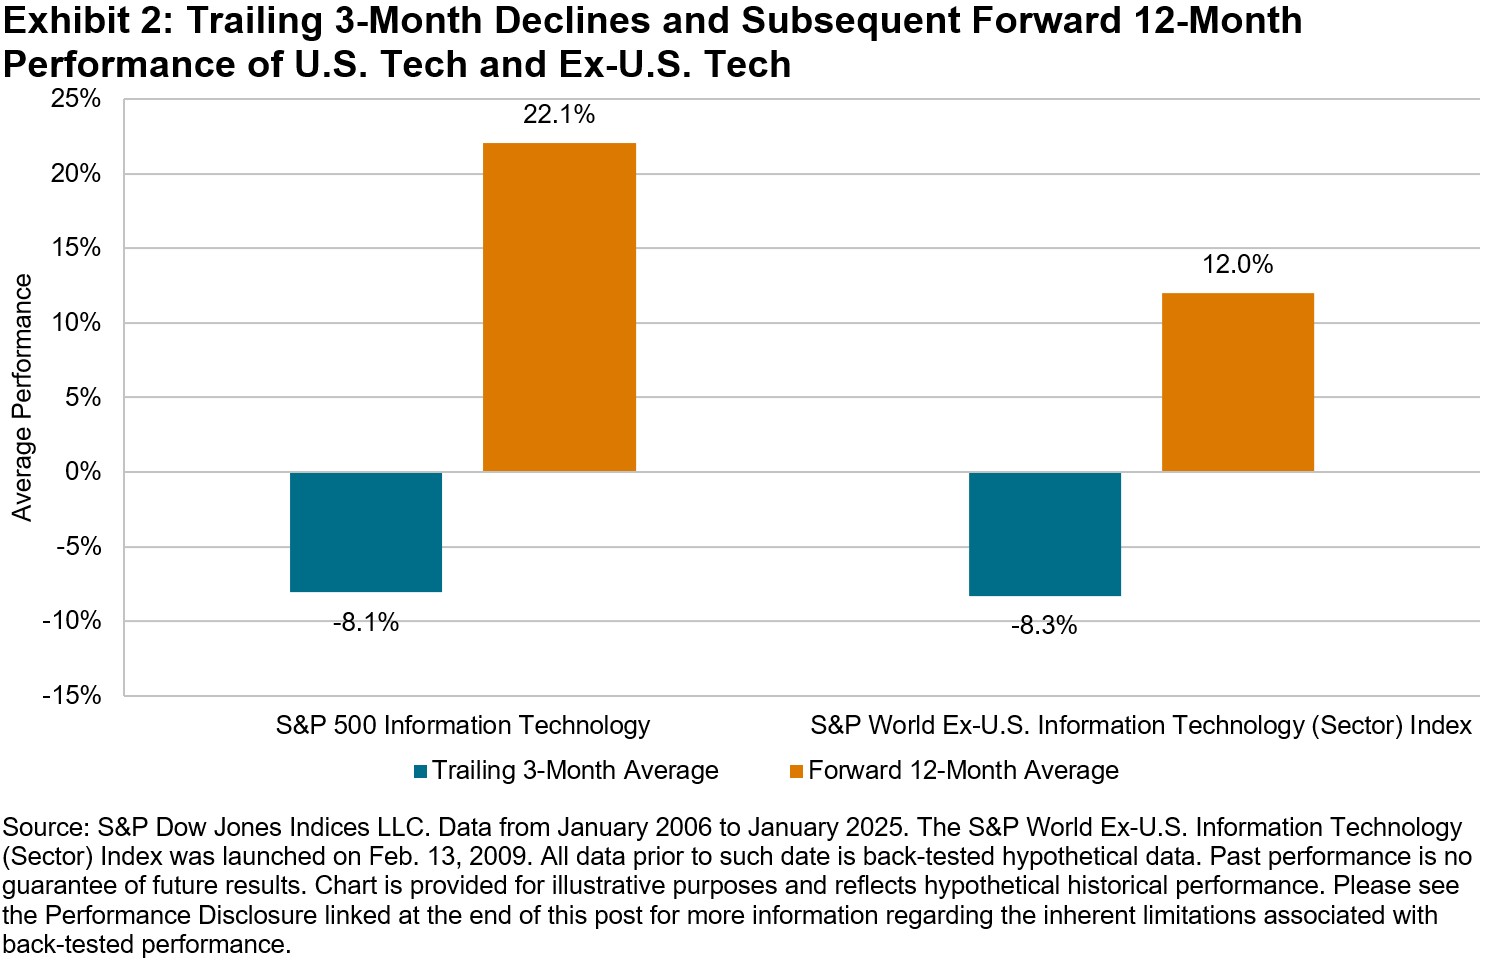
One might fairly ask what happened to U.S. Tech after previous three-month declines, and how its performance compared to the same sector around the rest of the world at those times. As it turns out, Information Technology showed resilience worldwide, but particularly so in the U.S. Exhibit 2 plots performance of two sector indices, the S&P 500 Information Technology and the S&P World Ex-U.S. Information Technology (Sector) Index (“Ex-U.S. Tech”) over 12-month periods after 3-month declines since January 2006. Following periods of three-month declines, U.S. Tech typically rebounded at a greater magnitude than did Ex-U.S. Tech, increasing an average of 22.1% over the subsequent 12 months and outperforming The 500 by 7.6%, while 3-month drops in Ex-U.S. Tech were followed by average total performance of 12.0% and 1.5% excess performance versus the S&P World Ex-U.S. Index.
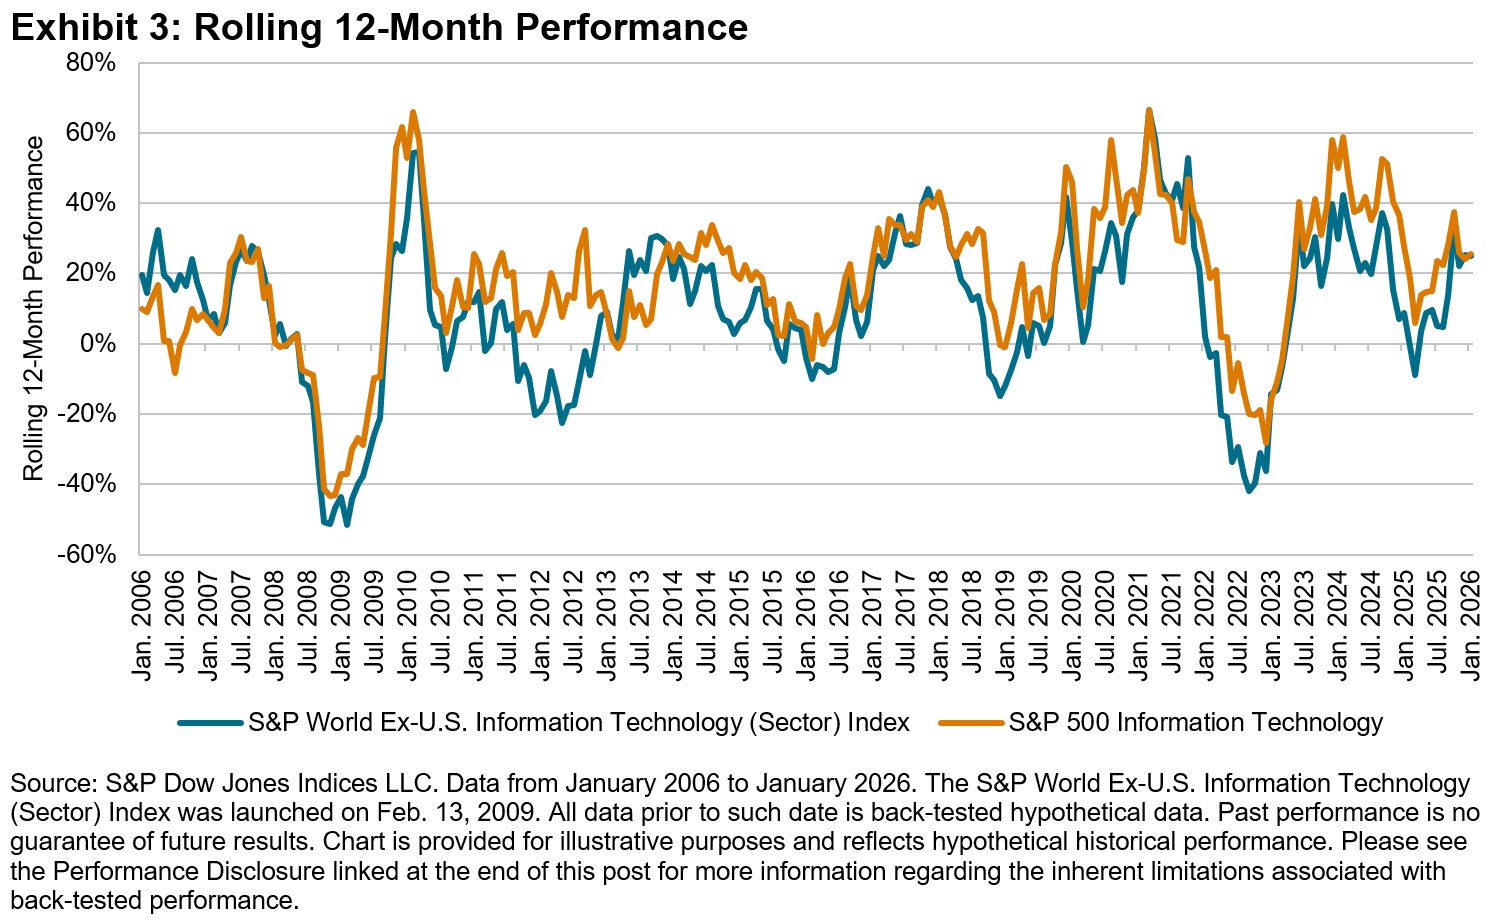
Shifting focus away from periods of decline and instead evaluating all periods in the last 20 years, we find that U.S. Tech often tended to lead its global counterparts. During 12-month periods when U.S. Tech was in an outperformance cycle relative to The 500, it simultaneously outperformed the rest of the world (as measured by the S&P World Ex-U.S. Index) 91% of the time, as shown in Exhibit 3. In such periods, U.S. Tech also generated higher performance than Ex-U.S. Tech 88% of the time.
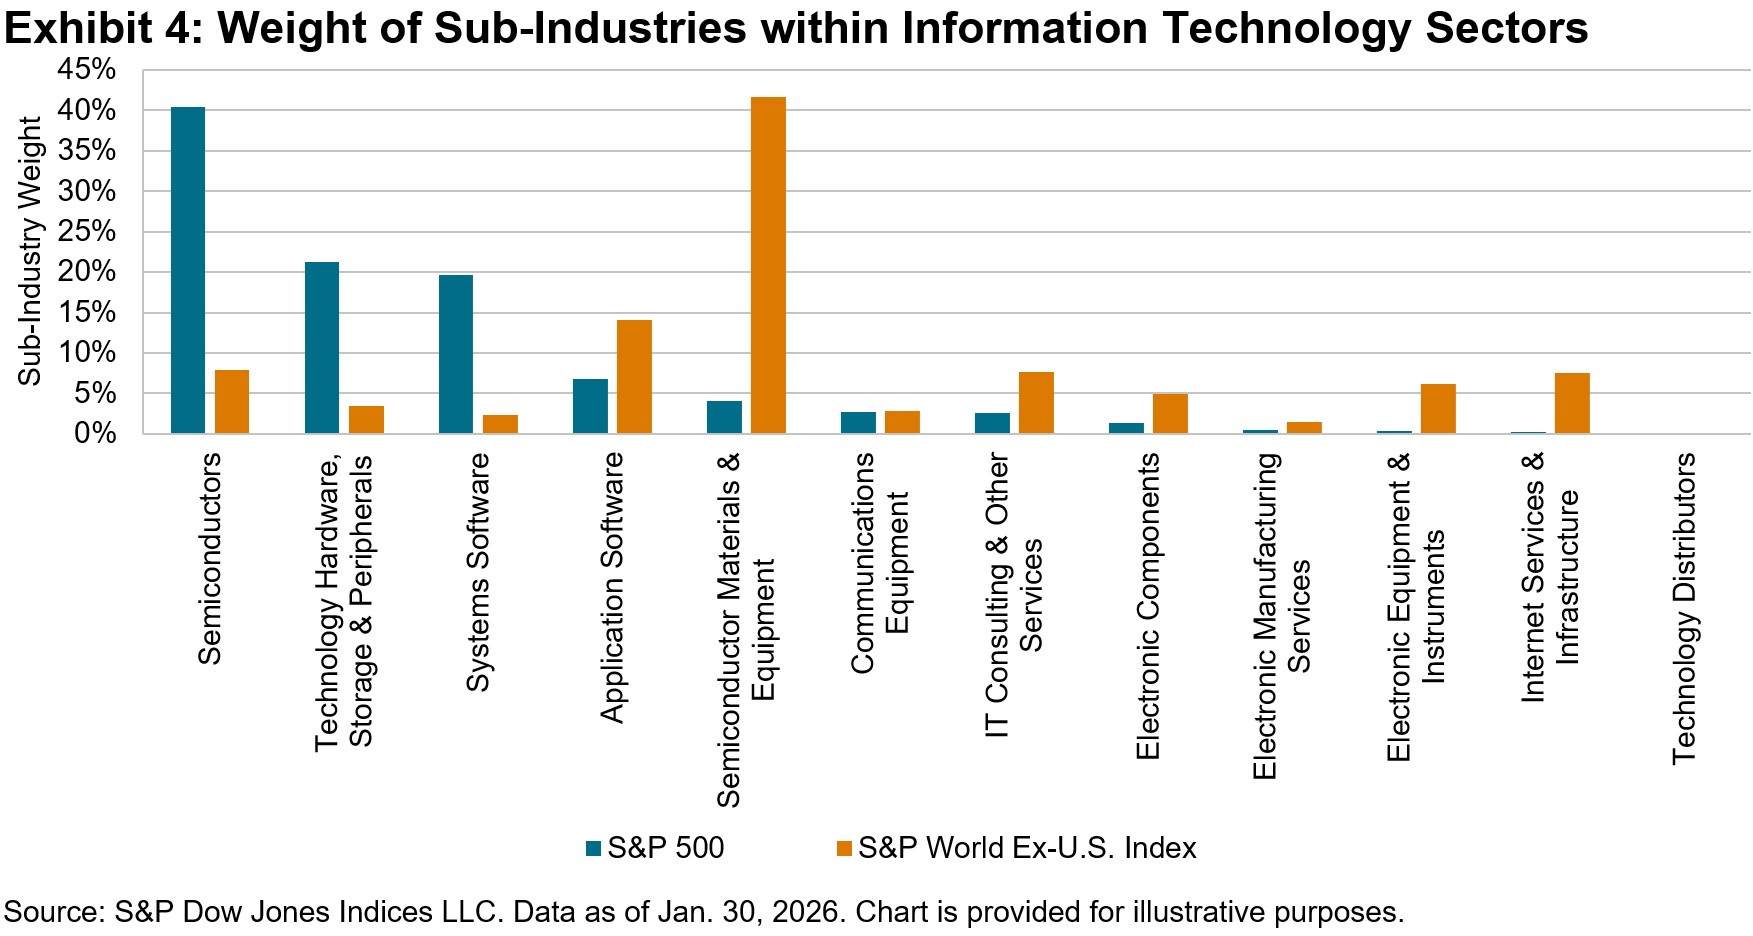
While sector membership explains a significant portion of constituent performance across different parts of the market and the economic cycle, variations in same-sector performance across geographies reveal the importance of understanding more granular constituent categorizations. In Exhibit 4, we begin to uncover potential drivers of U.S. Tech performance relative to its Ex-U.S. Tech counterpart, illustrating significant differences in GICS sub-industry weights. Specifically, the Semiconductors sub-industry comprised over 40% of U.S. Tech’s weight, yet only 8% of Ex-U.S. Tech’s, which held its largest weight (42%) in Semiconductor Materials & Equipment. Among the two sub-industries, Semiconductors significantly outperformed, aided by greater margins and pricing power for firms further down the AI chip value chain.
History has shown that periods of U.S. Tech underperformance have often been followed by periods of relative strength, and drivers of such sector resilience can be better understood through considering additional dimensions of geography and sub-industry composition. Like other sectors, Information Technology continues to evolve and reveal new clues that help to understand and navigate global markets.
Notes:
The S&P World Index comprises S&P World Ex-U.S. Index and S&P United States LargeMidCap.
The author thanks Tom Olins for his research contributions to this blog.
The posts on this blog are opinions, not advice. Please read our Disclaimers.S&P High Yield Dividend Aristocrats Expands with Eight New Members in the Latest Reconstitution

Wenli Bill Hao
Director, Factors and Dividends Indices, Product Management and Development
S&P Dow Jones Indices
The S&P High Yield Dividend Aristocrats® (S&P HYDA) includes large-, mid- and small-cap U.S. companies that have consistently raised their dividends for at least 20 consecutive years. This blog will examine the recent rebalance of the S&P HYDA, detailing the changes in its constituents and their distribution by size and sector. Additionally, we will highlight the dividend increase history of these constituents.
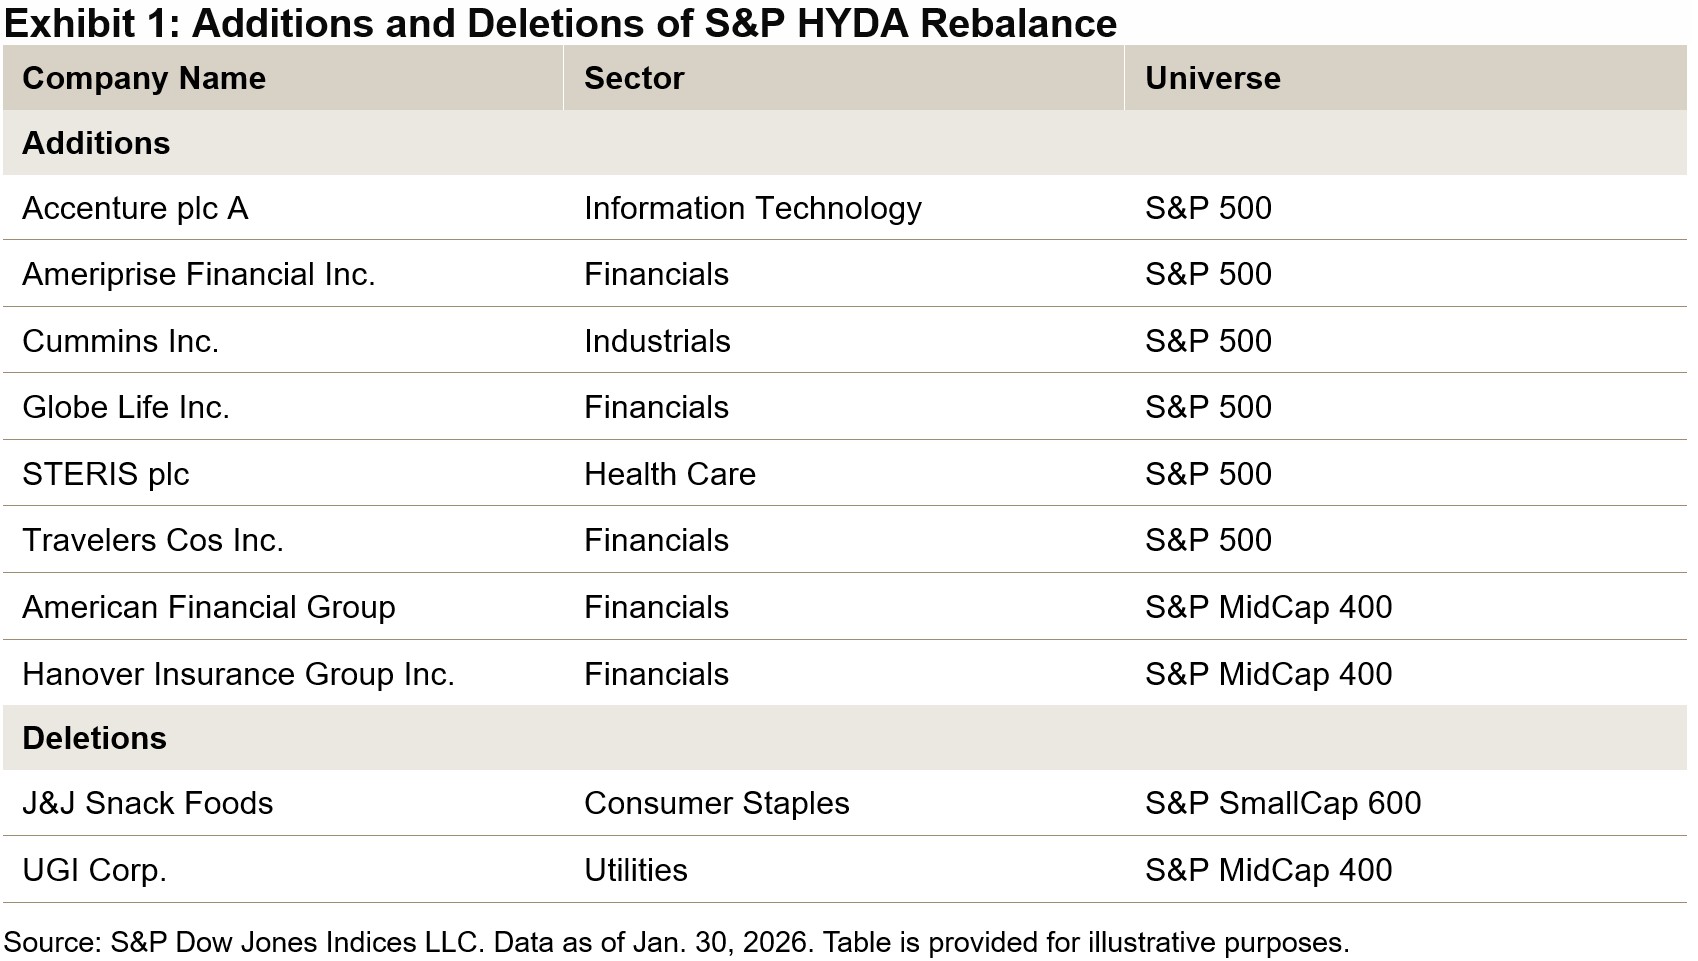
The index completed its annual reconstitution on Jan. 30, 2026, adding eight new members into this distinguished group (see Exhibit 1). With these additions and the removal of two constituents, the total number of index constituents increased from 149 to 155, further enhancing its diversification and liquidity.
Market-Cap Breakdown
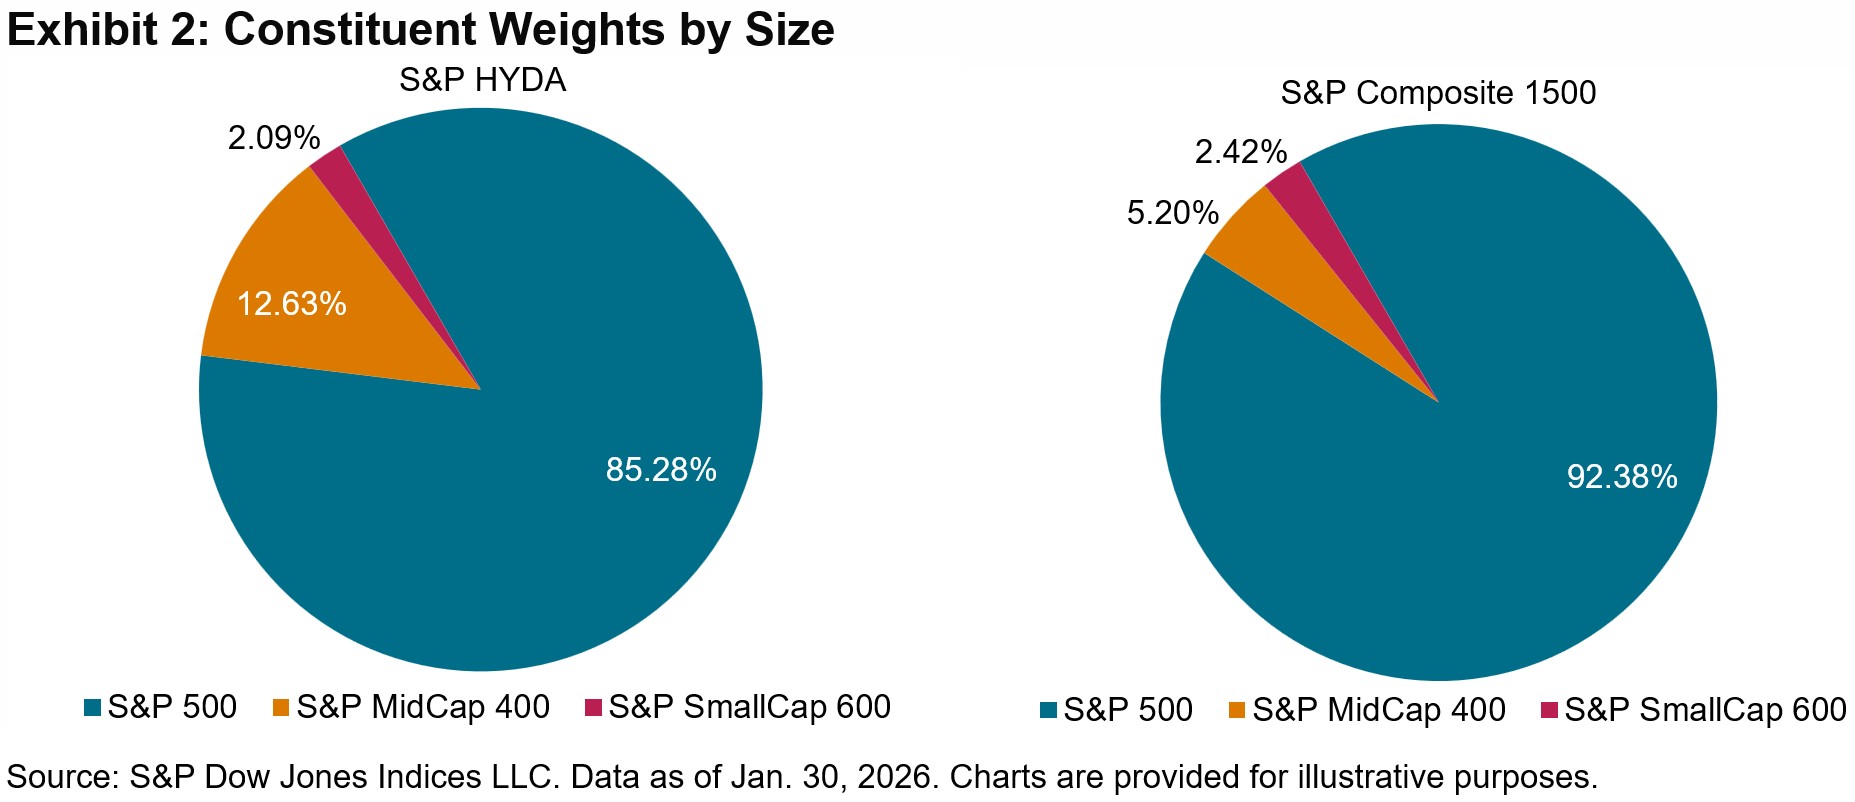
As of the latest rebalance, the S&P HYDA comprises 155 constituents: 102 stocks from the S&P 500®, 38 from the S&P MidCap 400® and 15 from the S&P SmallCap 600®. Notably, the S&P HYDA has a greater weight in the mid- and small-cap segments compared to the S&P Composite 1500®, as illustrated in Exhibit 2.
Sector Breakdown
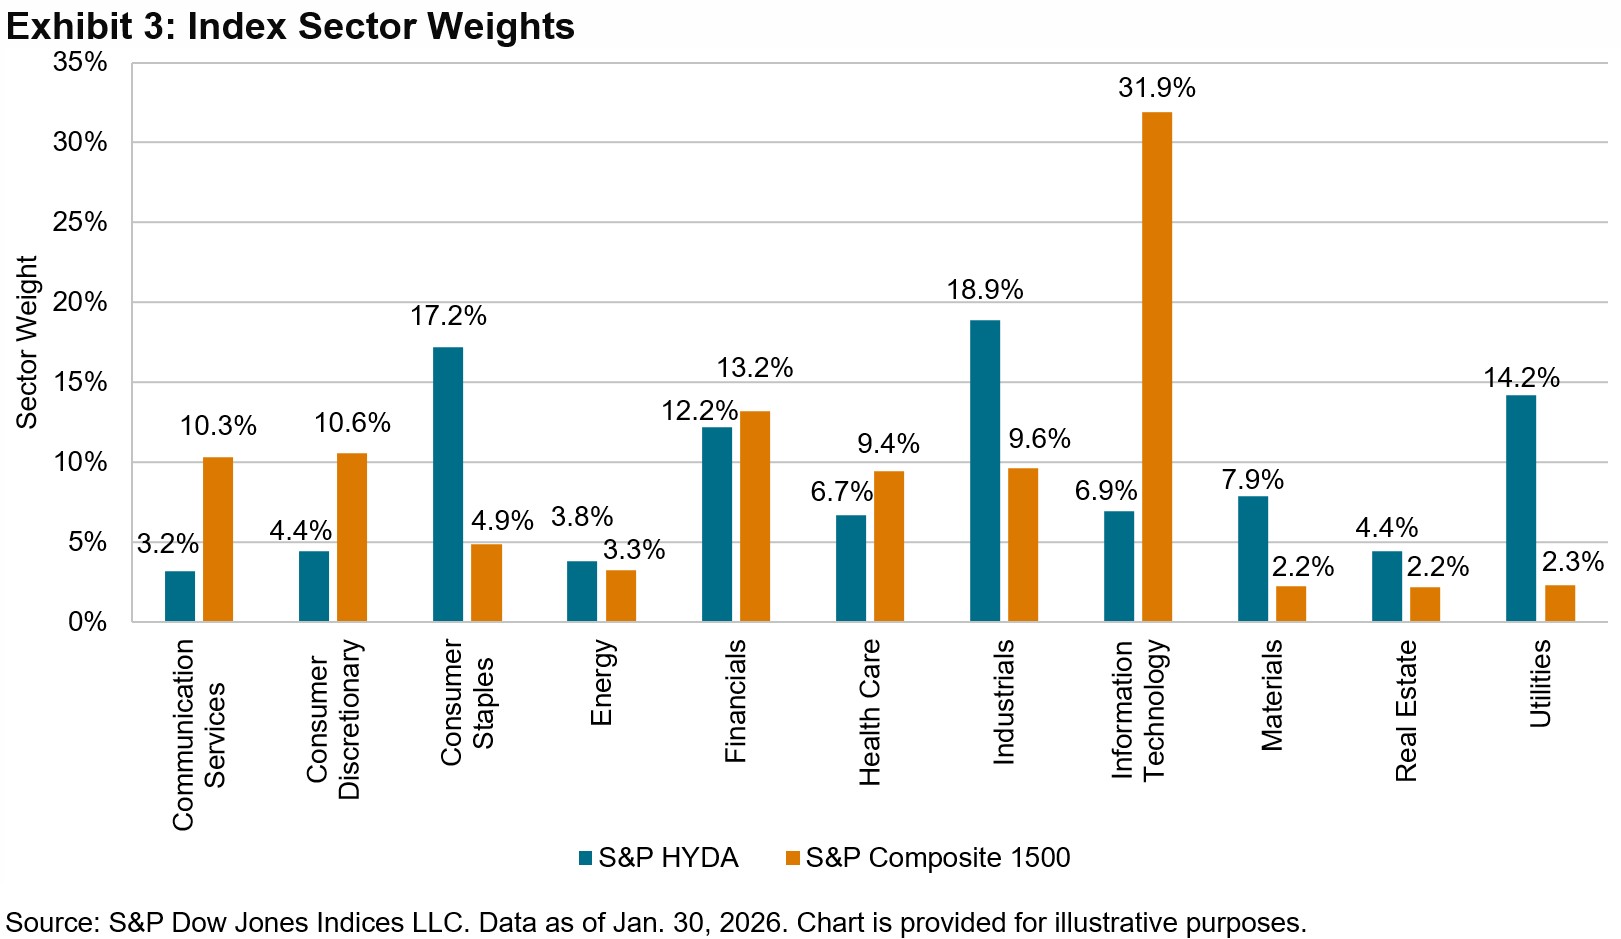
With 155 constituents, the S&P HYDA features representation from all 11 GICS® sectors: 35 constituents from Industrials, 29 from Financials, 21 from Utilities, 20 from Consumer Staples, 16 from Materials and 34 from the remaining 6 sectors.
As shown in Exhibit 3, the S&P HYDA is notably underweight in the Information Technology (-25.0%), Communications Services (-7.1%) and Consumer Discretionary (-6.1%) sectors. In contrast, the index is substantially overweight in Consumer Staples (12.3%), Utilities (11.9%) and Industrials (9.2%).
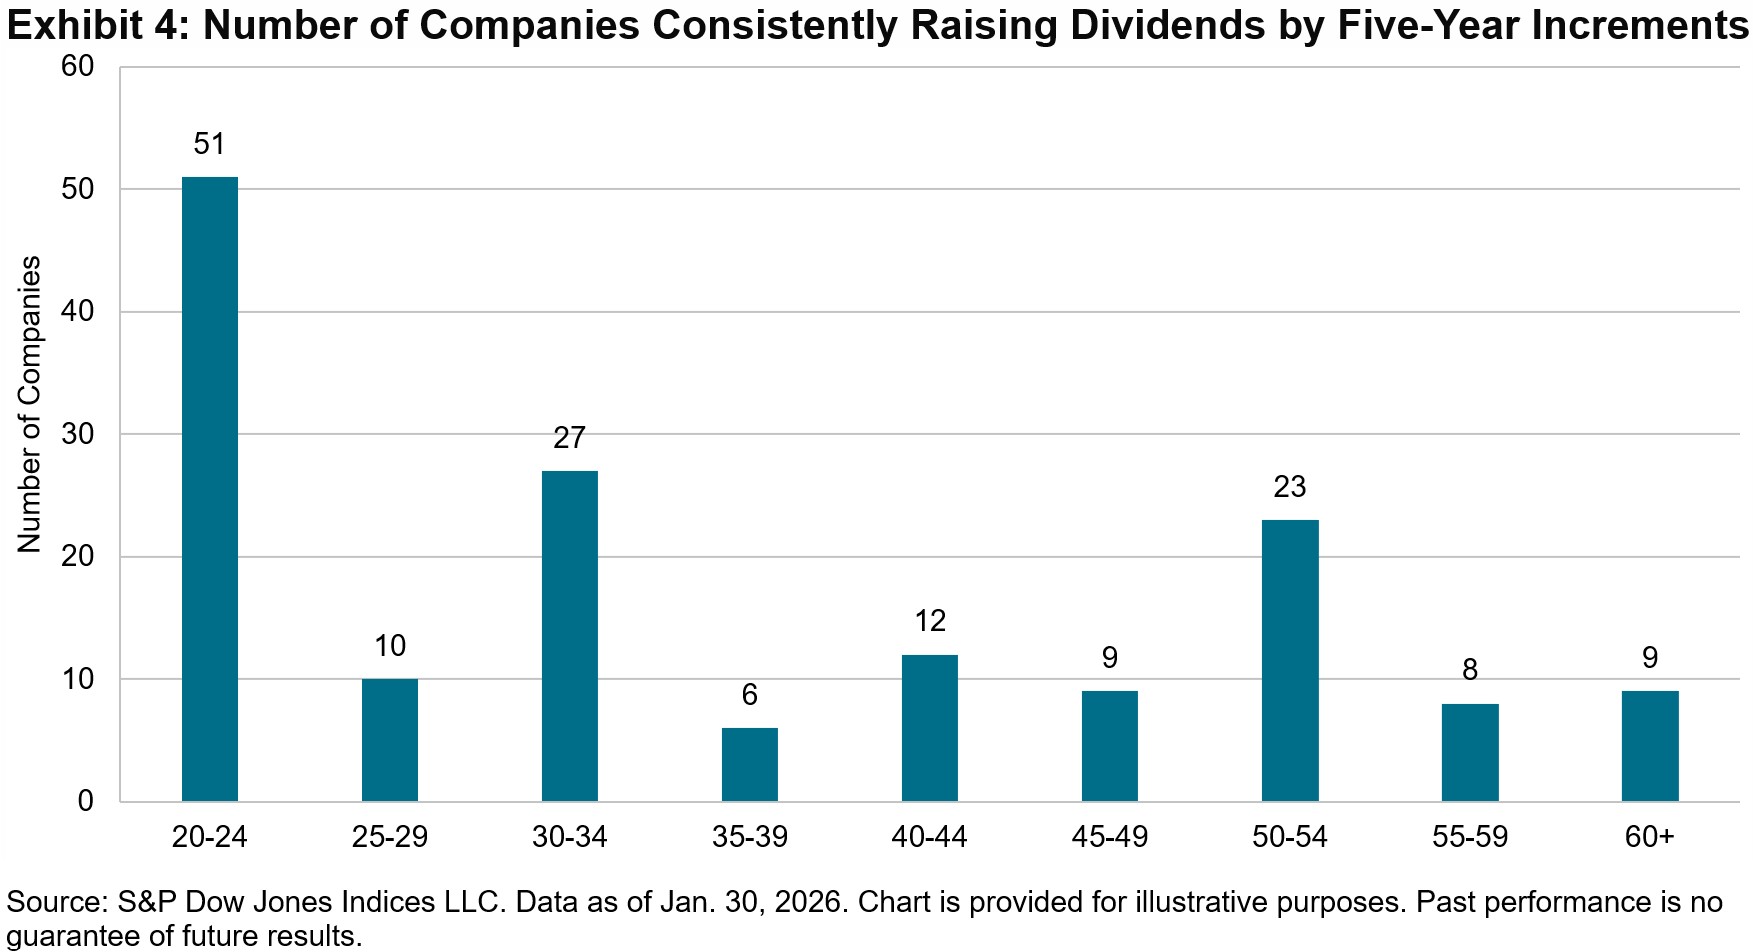
A Long History of Dividend Growth
Exhibit 4 presents the number of constituents that have increased their dividends in five-year increments. Roughly 33% of constituents have raised their dividends for 20 to 24 years, while 35% have done so for 25 to 44 years. Additionally, 32% of constituents have achieved this for 45 years or more. These track records highlight these companies’ longstanding ability and commitment to consistently increase dividends over multiple decades.