Canada’s investment landscape is often defined by the S&P/TSX 60, the benchmark that comprises the nation’s largest companies. These larger-cap companies—predominantly Financials and Energy firms—tend to lead headlines for portfolio allocations. Yet beneath the top tier of widely recognized names exists a dynamic segment that focuses on emerging leadership, innovation and diversification in Canada’s public markets.
The group of companies ranked just outside the flagship S&P/TSX 60—referred to here as the “Next 40”—reflect an important segment with the potential to transition to the S&P/TSX 60. This group represents a blend of mid-sized companies and emerging smaller caps with high potential, making the Next 40 a potential signal for the direction of the Canadian economy.
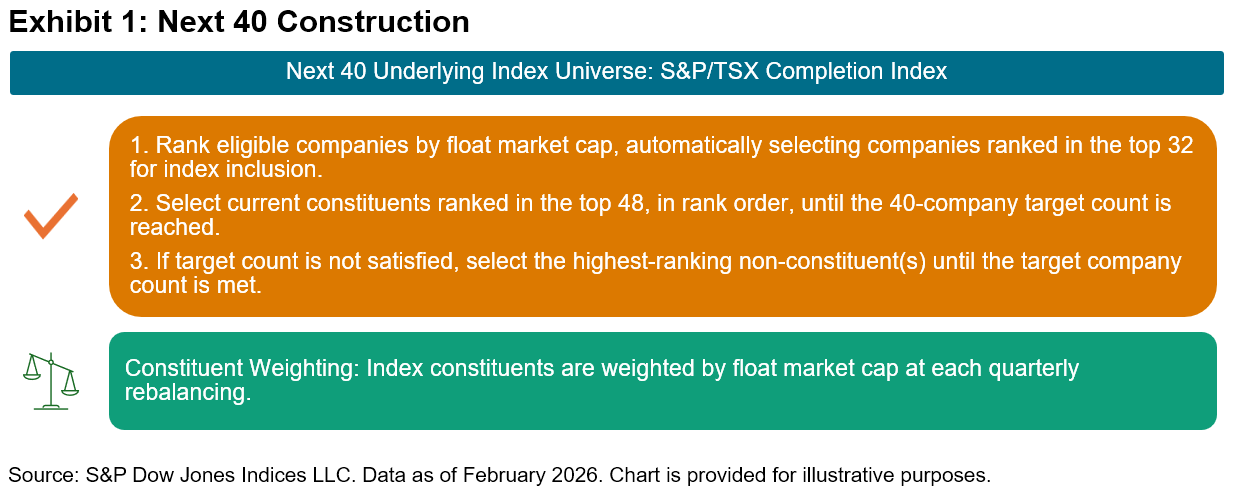
The Next 40 consists of the 40 largest constituents of the S&P/TSX Completion Index. Rebalancing quarterly on the third Friday of March, June, September and December, this basket maintains strict modularity with the flagship S&P/TSX 60. To preserve the distinction, any constituent added to the S&P/TSX 60 is removed from the Next 40 on an intra-quarter basis and replaced, ensuring no overlap between the two tiers.
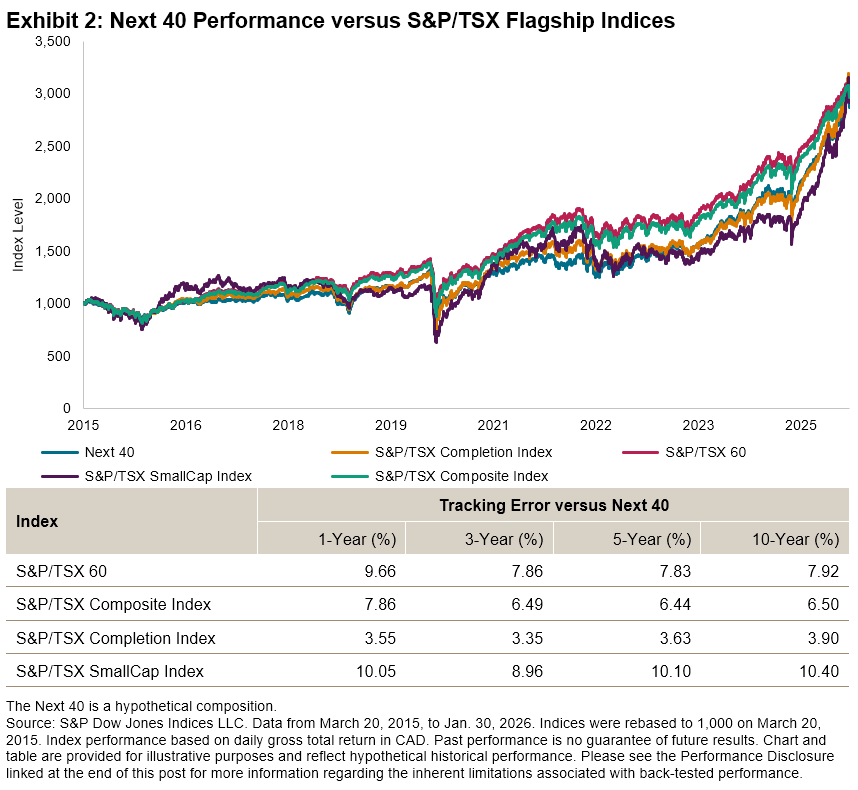
Over the period studied, the Next 40 tracked most closely to the S&P/TSX Completion Index, while also remaining competitive with the flagship S&P/TSX 60 and the broader S&P/TSX Composite Index (see Exhibit 2). Specifically, the Next 40 maintained a tracking error above 7% against the large-cap flagship, demonstrating that it was measuring a distinct market segment rather than acting as a redundant proxy. By contrast, its lower tracking error against the S&P/TSX Completion Index shows that it has historically been a reliable representation of the market, avoiding the unpredictability often found in smaller, less liquid stocks.
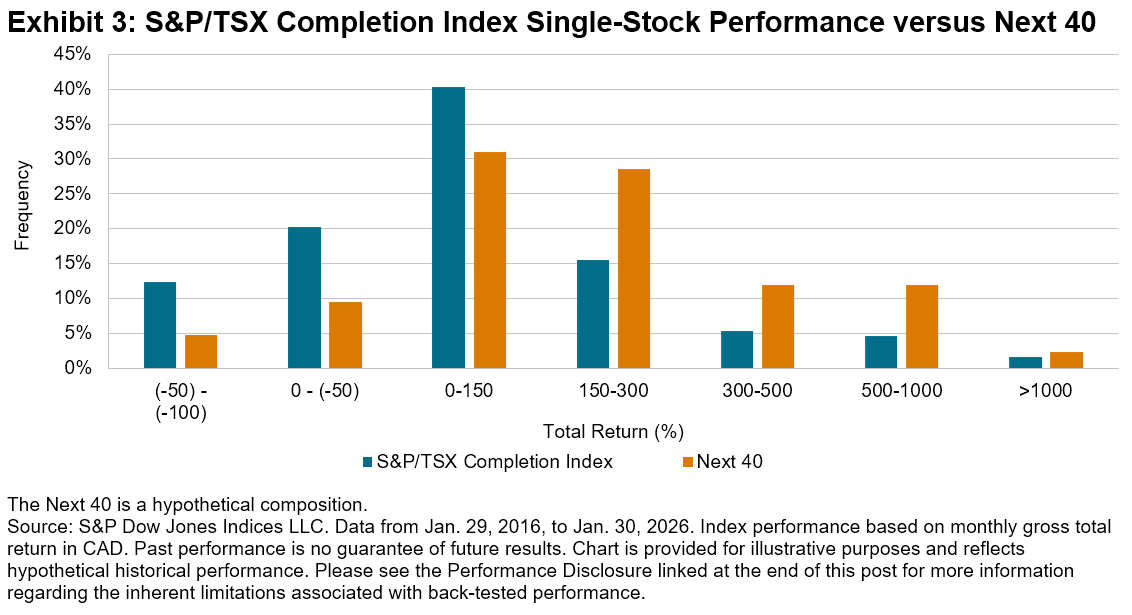
While the Next 40 tracked closely to the S&P/TSX Completion Index, it can act as a strategic filter that narrows the universe down to its most impactful stocks. By omitting smaller constituents that have historically underperformed, the Next 40 could serve as a more efficient version of the S&P/TSX Completion Index, focusing on how specific names tended to perform better than their peers over the 10-year period reflected in Exhibit 2. As shown in Exhibit 3, this refinement allowed the components in this statistic to populate the top-tier brackets—specifically those with a total return exceeding 150%—more consistently than the broader universe.
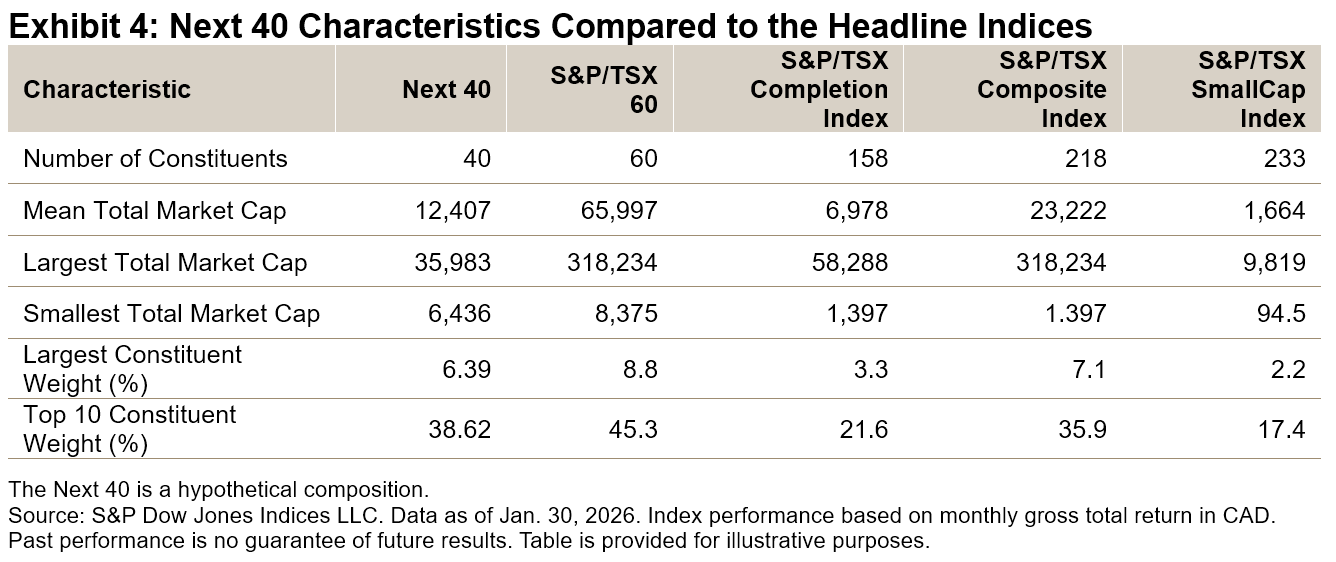
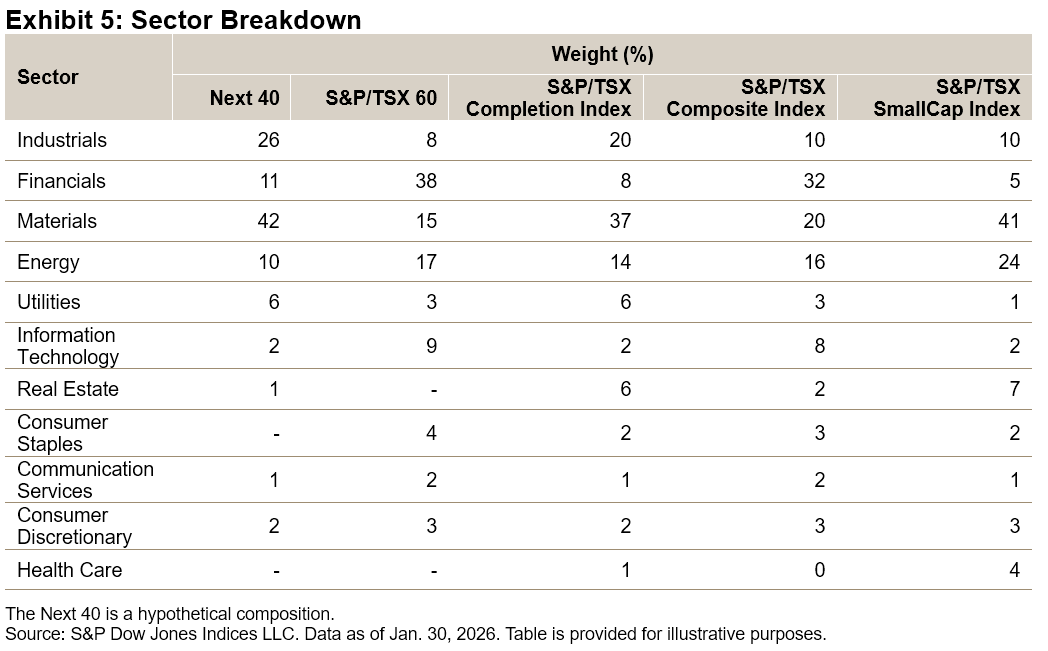
While the S&P/TSX 60 tends to be characterized by heavy concentration in mega-cap entities, the Next 40 has tended to have more balanced weights, with the largest constituent holding a weight of only 6.39% (see Exhibit 4). This differentiation is further supported by the varied sector contribution over the years (see Exhibit 5). While Financials remained a core pillar, sectors like Industrials and Materials have gained meaningful participation as well.
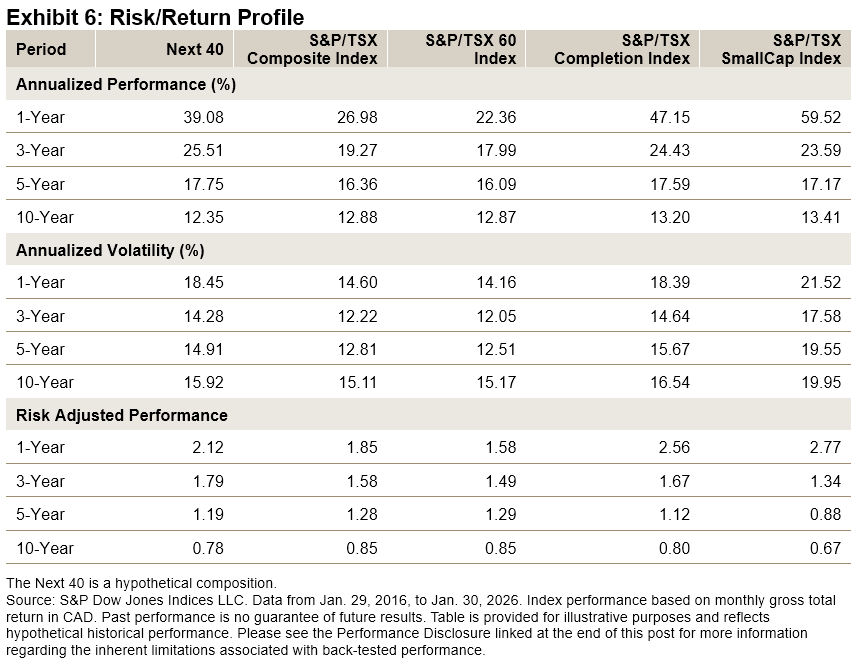
The Next 40 represents a compromise between size stability and growth dynamism. Over the 10-year period, the S&P/TSX Composite Index and the S&P/TSX 60 had high annualized returns. The Next 40 had only slightly higher volatility than the S&P/TSX 60, which reinforces its focus on the largest, most established firms outside of the traditional top tier.
Conclusion
The Next 40 is more than just an overflow list: it’s an indicator of the more liquid mid-cap segment of Canadian equities. By moving beyond the mega-cap concentration of the S&P/TSX 60, the Next 40 reduces focus on a handful of giants by seeking innovation in sectors that tend to be under-represented in the top tier. For a broader perspective on Canadian equities, incorporating a structured view of these firms may provide a fresh lens into where growth and innovation may emerge.
The author would like to thank Tom Phillips for producing analysis and data underlying this post.
The posts on this blog are opinions, not advice. Please read our Disclaimers.