Get Indexology® Blog updates via email.

In This List

Advisor Profile: Getting the Most out of Index Provider Content

S&P 500 Quality FCF R&D Leaders Index: Highlighting Innovation, Growth and Fundamental Strength

SPIVA South Africa: Key Insights and Trends

Animal Spirits or Anxiety?

Fixed Income Funds and Their Fortunes

Advisor Profile: Getting the Most out of Index Provider Content

Contributor Image
Brandon Hass

Global Head of Client Solutions Group, Direct Indexing and Model Portfolios

S&P Dow Jones Indices

As financial advisors increasingly use index-based strategies to help scale their practices, many are turning to index providers not only for benchmarks—but also for insights. A recent whitepaper1 from Cerulli Associates analyzes why and how a segment of advisors, known as “index provider content users,” are actively using these insights to inform their decision-making and client interactions.

Why and How Advisors Use Index Provider Content

According to Cerulli, 37% of financial advisors report using index providers’ information, with independent registered investment advisors (RIAs) being the type of advisor most likely (44%) to use these inputs.2

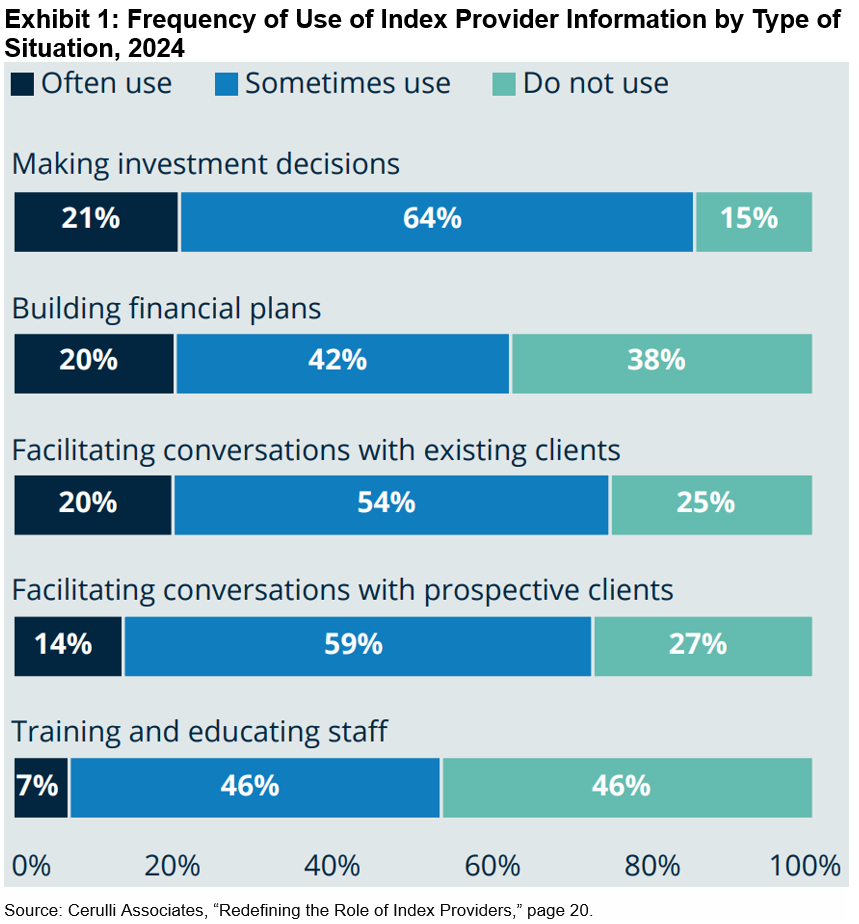
Advisors are using data, thought leadership and methodology documentation as they carry out a range of advisory functions. As shown in Exhibit 1, the most common use cases are to make investment decisions (85%) and facilitate conversations with clients (74%) and prospects (73%). Some advisors are also using content as they build financial plans (62%) and train and educate their staff (53%).2 As an independent RIA interviewed by Cerulli noted, “I rely on the S&P Persistence Scorecards and an index scorecard. I am informed by some of that data.”2

These practices illustrate how index providers can potentially play a broader role in educating wealth managers by offering resources that help advisors articulate the potential value of index-based strategies to their clientele.

Commonly Used Index-Based Product Information

Cerulli finds that advisors prefer a range of content formats, depending on the context. For longer-form education and training, advisors tend to gravitate toward in-person meetings, whitepapers and webinars delivered on a quarterly or annual basis. Advisors are more likely to read emails, newsletters and blogs on at least a monthly basis.

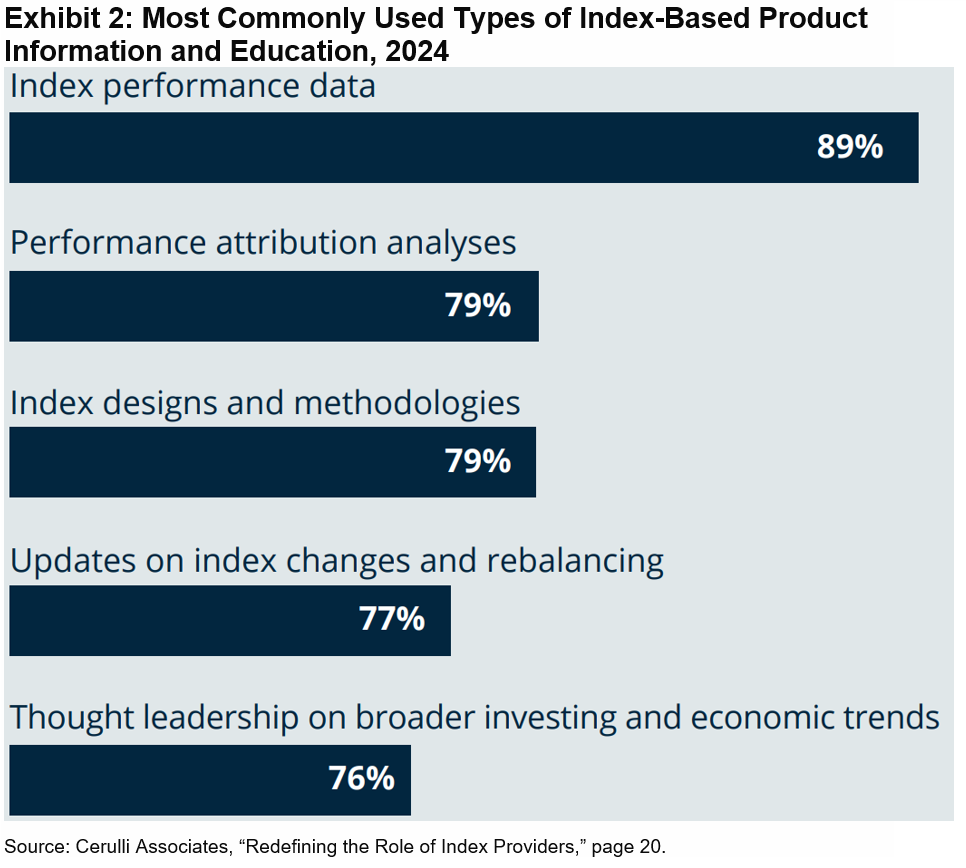
As shown in Exhibit 2, the most commonly used types of index-based product information and education by these advisors are index performance data (89%), performance attribution analyses (79%) and documentation on index designs and methodologies (79%). Advisors also report using updates related to index changes and rebalancing (77%), as well as thought leadership on broader investing and economic trends (76%).2

Turning Insights into Differentiation

The survey results and interviews with advisors suggest that index providers can play a valuable role in expanding the index education content ecosystem by providing an independent and differentiated perspective. “It might be helpful to hear from [index providers] because asset managers are incentivized to push products and are not always the best purveyors of information,” one wirehouse advisor said.3

By offering accessible, client-facing materials that explain index design, methodology and performance, index providers deliver content that may inform advisors’ conversations with clients and prospects alike. As more advisors seek to explain how and why index-based strategies work, the ability to tap into credible, easy-to-use materials may become a key differentiator in growing their practices.

To learn more about how financial advisors are using index provider resources and related implications, explore the full Cerulli whitepaper, “Redefining the Role of Index Providers.”


1 The Cerulli Associates whitepaper “Redefining the Role of Index Providers” was sponsored by S&P Dow Jones Indices.

2 Please see page 20 of Cerulli Associates’ “Redefining the Role of Index Providers.”

3 Please see page 15 of Cerulli Associates’ “Redefining the Role of Index Providers.”

The posts on this blog are opinions, not advice. Please read our Disclaimers.

S&P 500 Quality FCF R&D Leaders Index: Highlighting Innovation, Growth and Fundamental Strength

Contributor Image
Wenli Bill Hao

Director, Factors and Dividends Indices, Product Management and Development

S&P Dow Jones Indices

Research and development (R&D) investment is often a key indicator of innovation, competitiveness and a forward-looking mindset—qualities that may drive future revenue streams and market leadership. Comparing R&D Intensity1 across companies can help identify those that are dedicating significant resources to developing new products, technologies or services capable of disrupting industries and generating lasting value. The recently launched S&P 500 Quality FCF R&D Leaders Index tracks high R&D Intensity companies that also demonstrate robust cash flows. In this blog, we will explore the index’s design, historical performance and fundamental characteristics.

Methodology Overview2

The S&P 500 Quality FCF R&D Leaders Index employs a sequential process that begins with the selection of companies exhibiting above-median free cash flow (FCF) margin and FCF return on invested capital (ROIC).3 This initial step helps ensure that only higher-quality companies, better positioned to sustain their investments in R&D, are considered. From this subset, the top 50 companies with the highest R&D Intensity are selected for inclusion in the index. Constituents are then weighted proportional to their R&D Intensity Score.

Back-Tested Outperformance

Across the full back-tested period, the S&P 500 Quality FCF R&D Leaders Index demonstrated significant outperformance compared to its benchmark universe (see Exhibit 2), albeit with higher volatility. In the shorter term, the index outperformed across the 1-, 3- and 5-year back-tested horizons.

Higher Growth and Profitability

Selecting companies based on FCF quality and R&D intensity helps identify companies that are both financially sound and positioned for future growth. These characteristics are reflected in historical fundamentals, as the S&P 500 Quality FCF R&D Leaders Index exhibited greater earnings and sales growth, higher profit margins and lower levels of leverage compared to its underlying universe (see Exhibit 3).

Innovation and Disruptive Technology – The Key Themes

Selecting companies based on R&D Intensity tilts the sector composition toward innovation-driven sectors and industries. At the sector level, the index has a 63.19% weight in Information Technology and a 30.82% weight in Health Care (see Exhibit 4). At the industry level, the top five industries within the index are Semiconductors, Application Software, Pharmaceuticals, Biotechnology and Systems Software (see Exhibit 5). Each of these industries plays a vital role in shaping the future of the Information Technology and Health Care sectors, driving growth and contributing to significant advancements across the market.

Conclusion

By selecting companies with high FCF and high R&D Intensity, the S&P 500 Quality FCF R&D Leaders Index has historically identified innovative, high-growth companies that are financially sound. These companies are not only focusing on future growth but also generating consistent cash to sustain innovation efforts without relying on excessive debt.


1 R&D Intensity is defined as R&D expenditures by a firm divided by its revenue.

2 For further details, please refer to the S&P Quality FCF R&D Leaders Index Methodology.

3 Bebb, Elizabeth et al. “The S&P Quality FCF Aristocrats® Indices – Exploring the Principles of Consistency and Efficiency in Free Cash Flow Metrics.” S&P Dow Jones Indices. April 24, 2025.

The posts on this blog are opinions, not advice. Please read our Disclaimers.

SPIVA South Africa: Key Insights and Trends

How can the latest SPIVA Scorecard help inform investors in South Africa? S&P DJI’s Tim Edwards dives into the latest SPIVA results and the trends driving South Africa’s evolving active vs. passive landscape with Asset TV’s Mosidi Modise. 

The posts on this blog are opinions, not advice. Please read our Disclaimers.

Animal Spirits or Anxiety?

Contributor Image
Anu Ganti

Head of U.S. Index Investment Strategy

S&P Dow Jones Indices

Big Tech and the strength of the Magnificent 7 stocks have powered the S&P 500® to 36 all-time closing highs through the end of October. Amid the euphoria, nervousness about the AI boom1 has sent jitters through the market, most recently with SoftBank’s sale of its stake in Nvidia.

The extreme level of mega-cap dominance is reflected through the S&P 500 Equal Weight Index, whose trailing 12-month underperformance versus the S&P 500 plunged to 13% as of Oct. 31, 2025, with even worse levels seen in 1999 prior to the bursting of the tech bubble. With bubble fears in the air, it might be helpful to travel back to the past to understand the challenges of stock selection, especially throughout turbulent market regimes, with the knowledge that only a handful of stocks have outperformed over the long term.

Imagine it is Dec. 31, 1999. You are a professional portfolio manager and have witnessed five consecutive years of double-digit gains for the S&P 500, with a cumulative return of 253%. You are a bit apprehensive about whether these gains can continue and decide to seek five stock recommendations from your favorite Wall Street forecasters, denoted as Stocks 1-5,2 which you carefully consider.

Luckily for you, a genie appears to grant you one wish. You decide to ask which of the five stocks will be the best performer in the future. Unfortunately, our genie lacks expertise in one important respect: she knows a good bit about volatility but less about the returns of individual stocks.

The genie first reveals the future volatility of each stock, measured simply by the annualized standard deviation of daily returns. Exhibit 1 shows that all five stocks will be more volatile than the S&P 500, with standard deviations ranging from 59% (Stock 1) to 26% (Stock 5).

You’re a bit nervous about the high volatility of the first stock, but Stock 5, while still more volatile than The 500™, looks relatively more benign. The genie next tells you about the frequency of large losses in Exhibit 2, which shows the probability of the stocks declining by at least 1% or at least 5% on a single day. Stock 1 is the most likely of the group to have large daily losses, which has increased your anxiety.

It is now Nov. 13, 2025, and it’s time to evaluate how well each of the forecasters did and how well you would have done to have taken their advice. Exhibit 3 tells us the actual identity of the five stocks and their total return since Dec. 31, 1999. Stock 1, Nvidia, was the best performer in our study,3 with a stunning cumulative performance of more than 200,000%, followed by Apple, Amazon and Microsoft. Stock 5, Exxon, although the least volatile, underperformed The 500.4

On a risk dimension, the best performer was the most volatile holding. Volatility tests an investor’s conviction, and sometimes the stocks you will have most wanted to own are the hardest to hold. This psychological difficulty is exacerbated for professional asset managers, who, acting as fiduciaries for their clients, may face challenges convincing them to stay confident when the market moves against their favor.

Going back to Dec. 31, 1999, you would not have known that tough times were soon in order, with the S&P 500 about to post declines for the next three consecutive years, followed later by the Global Financial Crisis of 2008. Much later would be the COVID-19-related downturn in 2020, the losses in 2022 and most recently the tariff-related tumult in early April 2025. Over long horizons, most stocks underperformed the market,5 and we know that most active managers underperformed with them, perhaps because historically, holding onto volatile stocks through painful periods of underperformance has required courage when one’s natural instinct is to sell.

1 https://www.nytimes.com/2025/11/07/business/stock-market-safety.html?unlocked_article_code=1.zU8.G-0a.Y8jQOKYocJwG

2 The stocks recommended can, but do not have to be a member of the S&P 500 at the time of this exercise.

3 The prescience of the forecaster who recommended Stock 1 is admirable, but we know that stock market forecasting is notoriously difficult, as any reader of our SPIVA® Scorecards will recognize.

4 Nvidia and Amazon joined the S&P 500 in November 2001 and November 2005, respectively.

5 Bessembinder, Hendrik.  “Which U.S. Stocks Generated the Highest Long-Term Returns,” Nov. 11, 2024.

The posts on this blog are opinions, not advice. Please read our Disclaimers.

Fixed Income Funds and Their Fortunes

Contributor Image
Agatha Malinowski

Quantitative Analyst, Index Investment Strategy

S&P Dow Jones Indices

Global fixed income markets have been buffeted by tariff-related tensions and inflation concerns coupled with monetary policy uncertainty, with many central banks cutting rates, Japan in tightening mode and the U.S. Fed ending its quantitative tightening program. Focusing on the U.S. and Europe, sovereign yield curves in both regions have steepened since late 2024, with the spread between the 10- and 2-year Treasury yield rising to 53 bps as of Nov. 10, 2025. Corporate credit spreads have also remained near historic lows, narrowing by 23 bps in the U.S. since the start of the year while remaining marginally above zero in Europe, as shown in Exhibit 1. These evolving dynamics can create a mixture of challenges and opportunities for active managers seeking to outperform their benchmarks.

Reflecting on the first half of the year, how did bond pickers fare? According to our SPIVA® (S&P Indices Versus Active) Mid-Year 2025 Scorecards, 69%1 of bond funds globally underperformed their respective benchmarks on a fund-weighted basis, higher than the 54% observed for equities. Looking across the U.S. and Europe, Exhibit 2 highlights that 90% of U.S. General Investment Grade Funds and 88% of U.S. High Yield Funds lagged their respective benchmarks, while European managers saw lower, but still significant, rates of underperformance in these categories. However, there were a few pockets of opportunity. Notably, nearly two-thirds of U.S.-domiciled Emerging Market Debt Funds outperformed their benchmark, benefiting from the tailwind of a weaker U.S. dollar that may have eased repayment conditions for issuers of U.S. dollar-denominated debt.

To better understand these results, it’s important to consider the traditional drivers of excess return for bond managers. Exhibit 3 illustrates the impact of term, credit and illiquidity premia on bond markets this year. In the U.S., the normalization of the yield curve favored managers who increased duration risk, while moderate tilts to riskier credit may have contributed positively. In Europe, however, markets may have been more difficult to navigate, with mixed results from increased credit risk and allocation to longer-dated bonds often not paying off. Greater tilts toward illiquid bonds would not have helped in the U.S. and appeared to offer minimal benefits in Europe.

Similar trends emerged in other major markets, including Australia, China and the U.K., where shifting monetary and fiscal conditions may have affected managers’ opportunities to generate excess returns. Only 5 of the 13 headline categories shown in Exhibit 4 posted majority outperformance in H1, evidence that outperformance remains elusive across fixed income markets globally. Over a 15-year horizon, none of these reported categories managed to beat their benchmarks.

As we approach the end of the year, uncertainty over the U.S. Fed’s upcoming December rate decision, labor market weakness and economic growth concerns continue to weigh on market participants. We will have to wait for our year-end 2025 SPIVA results to find out if bond managers were up to the challenge. In the meantime, for a closer look at how active fixed income managers performed in the first half of the year, explore our SPIVA Library.

1   Calculated as the ratio of the number of funds underperforming YTD to the total number of funds at the beginning of the YTD period across all SPIVA regions.

The posts on this blog are opinions, not advice. Please read our Disclaimers.