


How can the latest SPIVA Scorecard help inform investors in South Africa? S&P DJI’s Tim Edwards dives into the latest SPIVA results and the trends driving South Africa’s evolving active vs. passive landscape with Asset TV’s Mosidi Modise.
The posts on this blog are opinions, not advice. Please read our Disclaimers.SPIVA South Africa: Key Insights and Trends
Animal Spirits or Anxiety?
Fixed Income Funds and Their Fortunes
SPIVA Mid-Year 2025 Results Around the World
Advisor Profile: How Direct Indexing SMA Users Evaluate Solutions and Indices
SPIVA South Africa: Key Insights and Trends
Animal Spirits or Anxiety?

Big Tech and the strength of the Magnificent 7 stocks have powered the S&P 500® to 36 all-time closing highs through the end of October. Amid the euphoria, nervousness about the AI boom1 has sent jitters through the market, most recently with SoftBank’s sale of its stake in Nvidia.
The extreme level of mega-cap dominance is reflected through the S&P 500 Equal Weight Index, whose trailing 12-month underperformance versus the S&P 500 plunged to 13% as of Oct. 31, 2025, with even worse levels seen in 1999 prior to the bursting of the tech bubble. With bubble fears in the air, it might be helpful to travel back to the past to understand the challenges of stock selection, especially throughout turbulent market regimes, with the knowledge that only a handful of stocks have outperformed over the long term.
Imagine it is Dec. 31, 1999. You are a professional portfolio manager and have witnessed five consecutive years of double-digit gains for the S&P 500, with a cumulative return of 253%. You are a bit apprehensive about whether these gains can continue and decide to seek five stock recommendations from your favorite Wall Street forecasters, denoted as Stocks 1-5,2 which you carefully consider.
Luckily for you, a genie appears to grant you one wish. You decide to ask which of the five stocks will be the best performer in the future. Unfortunately, our genie lacks expertise in one important respect: she knows a good bit about volatility but less about the returns of individual stocks.
The genie first reveals the future volatility of each stock, measured simply by the annualized standard deviation of daily returns. Exhibit 1 shows that all five stocks will be more volatile than the S&P 500, with standard deviations ranging from 59% (Stock 1) to 26% (Stock 5).

You’re a bit nervous about the high volatility of the first stock, but Stock 5, while still more volatile than The 500™, looks relatively more benign. The genie next tells you about the frequency of large losses in Exhibit 2, which shows the probability of the stocks declining by at least 1% or at least 5% on a single day. Stock 1 is the most likely of the group to have large daily losses, which has increased your anxiety.

It is now Nov. 13, 2025, and it’s time to evaluate how well each of the forecasters did and how well you would have done to have taken their advice. Exhibit 3 tells us the actual identity of the five stocks and their total return since Dec. 31, 1999. Stock 1, Nvidia, was the best performer in our study,3 with a stunning cumulative performance of more than 200,000%, followed by Apple, Amazon and Microsoft. Stock 5, Exxon, although the least volatile, underperformed The 500.4
On a risk dimension, the best performer was the most volatile holding. Volatility tests an investor’s conviction, and sometimes the stocks you will have most wanted to own are the hardest to hold. This psychological difficulty is exacerbated for professional asset managers, who, acting as fiduciaries for their clients, may face challenges convincing them to stay confident when the market moves against their favor.

Going back to Dec. 31, 1999, you would not have known that tough times were soon in order, with the S&P 500 about to post declines for the next three consecutive years, followed later by the Global Financial Crisis of 2008. Much later would be the COVID-19-related downturn in 2020, the losses in 2022 and most recently the tariff-related tumult in early April 2025. Over long horizons, most stocks underperformed the market,5 and we know that most active managers underperformed with them, perhaps because historically, holding onto volatile stocks through painful periods of underperformance has required courage when one’s natural instinct is to sell.
2 The stocks recommended can, but do not have to be a member of the S&P 500 at the time of this exercise.
3 The prescience of the forecaster who recommended Stock 1 is admirable, but we know that stock market forecasting is notoriously difficult, as any reader of our SPIVA® Scorecards will recognize.
4 Nvidia and Amazon joined the S&P 500 in November 2001 and November 2005, respectively.
5 Bessembinder, Hendrik. “Which U.S. Stocks Generated the Highest Long-Term Returns,” Nov. 11, 2024.
The posts on this blog are opinions, not advice. Please read our Disclaimers.Fixed Income Funds and Their Fortunes

Global fixed income markets have been buffeted by tariff-related tensions and inflation concerns coupled with monetary policy uncertainty, with many central banks cutting rates, Japan in tightening mode and the U.S. Fed ending its quantitative tightening program. Focusing on the U.S. and Europe, sovereign yield curves in both regions have steepened since late 2024, with the spread between the 10- and 2-year Treasury yield rising to 53 bps as of Nov. 10, 2025. Corporate credit spreads have also remained near historic lows, narrowing by 23 bps in the U.S. since the start of the year while remaining marginally above zero in Europe, as shown in Exhibit 1. These evolving dynamics can create a mixture of challenges and opportunities for active managers seeking to outperform their benchmarks.

Reflecting on the first half of the year, how did bond pickers fare? According to our SPIVA® (S&P Indices Versus Active) Mid-Year 2025 Scorecards, 69%1 of bond funds globally underperformed their respective benchmarks on a fund-weighted basis, higher than the 54% observed for equities. Looking across the U.S. and Europe, Exhibit 2 highlights that 90% of U.S. General Investment Grade Funds and 88% of U.S. High Yield Funds lagged their respective benchmarks, while European managers saw lower, but still significant, rates of underperformance in these categories. However, there were a few pockets of opportunity. Notably, nearly two-thirds of U.S.-domiciled Emerging Market Debt Funds outperformed their benchmark, benefiting from the tailwind of a weaker U.S. dollar that may have eased repayment conditions for issuers of U.S. dollar-denominated debt.

To better understand these results, it’s important to consider the traditional drivers of excess return for bond managers. Exhibit 3 illustrates the impact of term, credit and illiquidity premia on bond markets this year. In the U.S., the normalization of the yield curve favored managers who increased duration risk, while moderate tilts to riskier credit may have contributed positively. In Europe, however, markets may have been more difficult to navigate, with mixed results from increased credit risk and allocation to longer-dated bonds often not paying off. Greater tilts toward illiquid bonds would not have helped in the U.S. and appeared to offer minimal benefits in Europe.

Similar trends emerged in other major markets, including Australia, China and the U.K., where shifting monetary and fiscal conditions may have affected managers’ opportunities to generate excess returns. Only 5 of the 13 headline categories shown in Exhibit 4 posted majority outperformance in H1, evidence that outperformance remains elusive across fixed income markets globally. Over a 15-year horizon, none of these reported categories managed to beat their benchmarks.

As we approach the end of the year, uncertainty over the U.S. Fed’s upcoming December rate decision, labor market weakness and economic growth concerns continue to weigh on market participants. We will have to wait for our year-end 2025 SPIVA results to find out if bond managers were up to the challenge. In the meantime, for a closer look at how active fixed income managers performed in the first half of the year, explore our SPIVA Library.
1 Calculated as the ratio of the number of funds underperforming YTD to the total number of funds at the beginning of the YTD period across all SPIVA regions.
The posts on this blog are opinions, not advice. Please read our Disclaimers.SPIVA Mid-Year 2025 Results Around the World

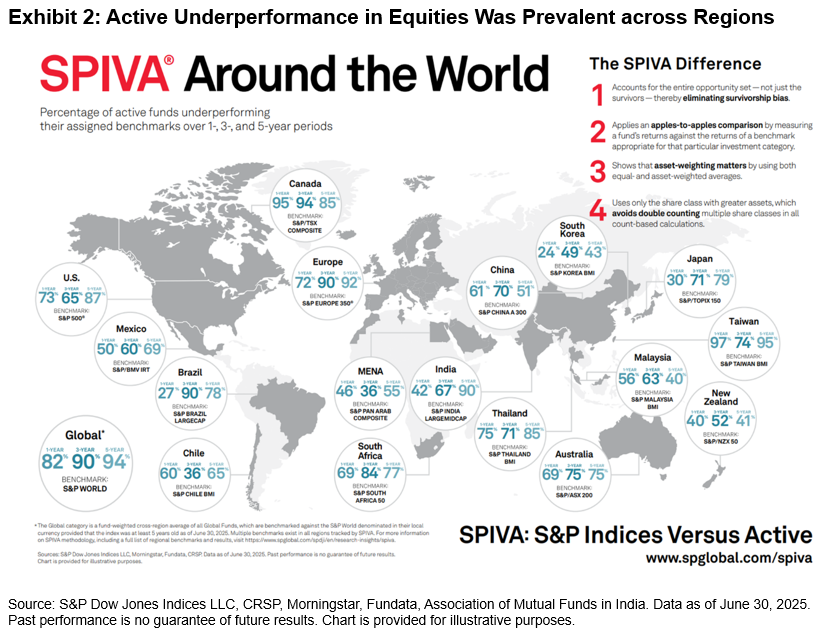
For more than 20 years, S&P DJI’s SPIVA® (S&P Indices Versus Active) Scorecards have been evaluating active funds’ performance against their appropriate benchmarks on a biannual basis. The results of our regional SPIVA Scorecards continue to show that active outperformance is rare, especially over the long term.1
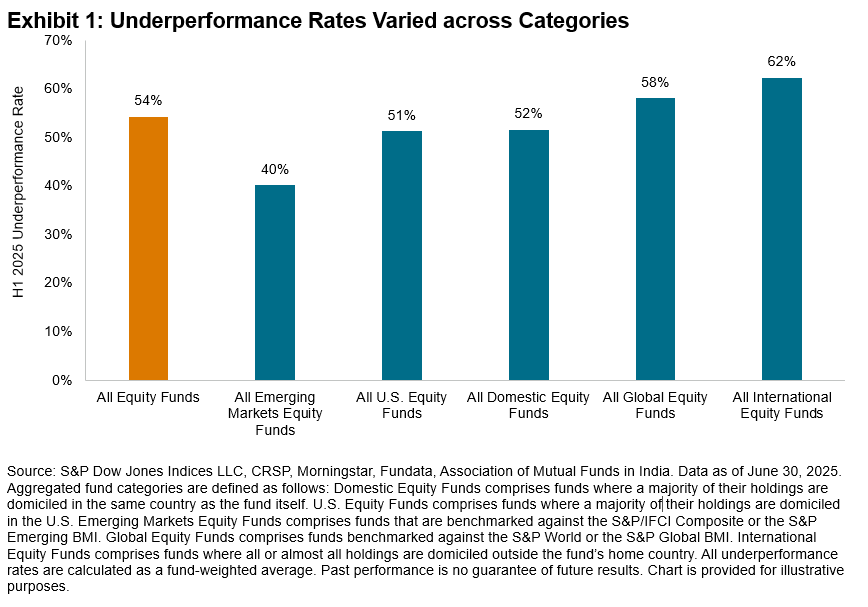
Spanning across 11 regions, 54% of all equity funds underperformed across categories.2 Not coincidentally, this result is consistent with the relatively benign 54% underperformance rate for our largest and most closely watched category of U.S. Large Cap Equity funds, which is on track for its lowest annual underperformance rate since 2022.
Outside of the U.S., there were additional bright spots, with Exhibit 1 showing that most Emerging Markets Equity funds outperformed, while International Equity and Global Equity funds had a slightly more difficult time beating their respective benchmarks.
Turning our attention to domestic equity managers across regions, 11 of our 17 reported domestic fund categories in Exhibit 2 posted majority underperformance in H1 2025. Results varied across regions; for example, only 17% of managers domiciled in Brazil underperformed the S&P Brazil LargeCap. Meanwhile, results were worse for South African managers, with 92% underperforming against the S&P South Africa 50. The 1-, 3- and 5-year underperformance rates for these funds and more are shown in Exhibit 2.
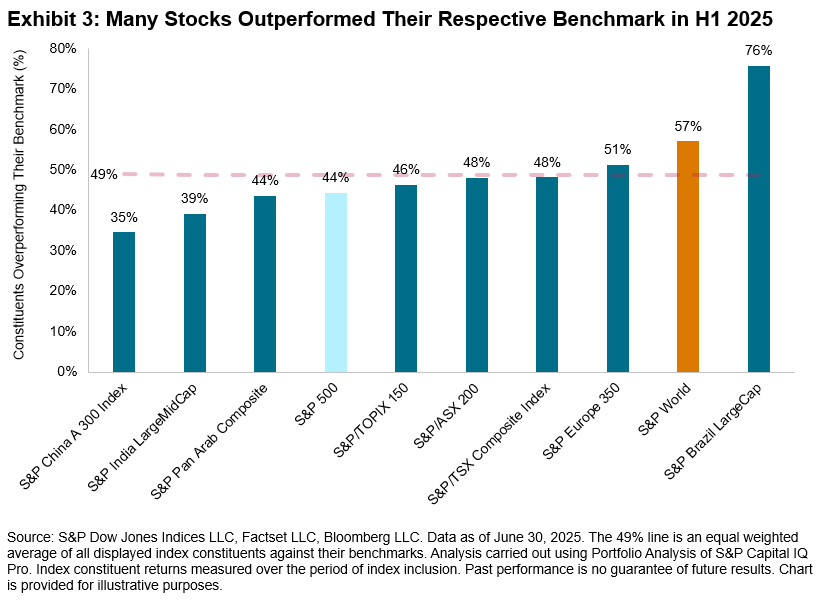
Offering perspective on the prospects for stock pickers globally, Exhibit 3 shows the percentage of constituents that beat the benchmark across categories. On average, 49% of stocks outperformed their respective benchmarks across regions. The 44% rate for the S&P 500® notably displayed a significant improvement compared to 2023 and 2024, both challenging years driven by mega-cap dominance. The majority outperformance of Brazil domestic funds is perhaps consistent with the fact that 76% of stocks outperformed their benchmark.
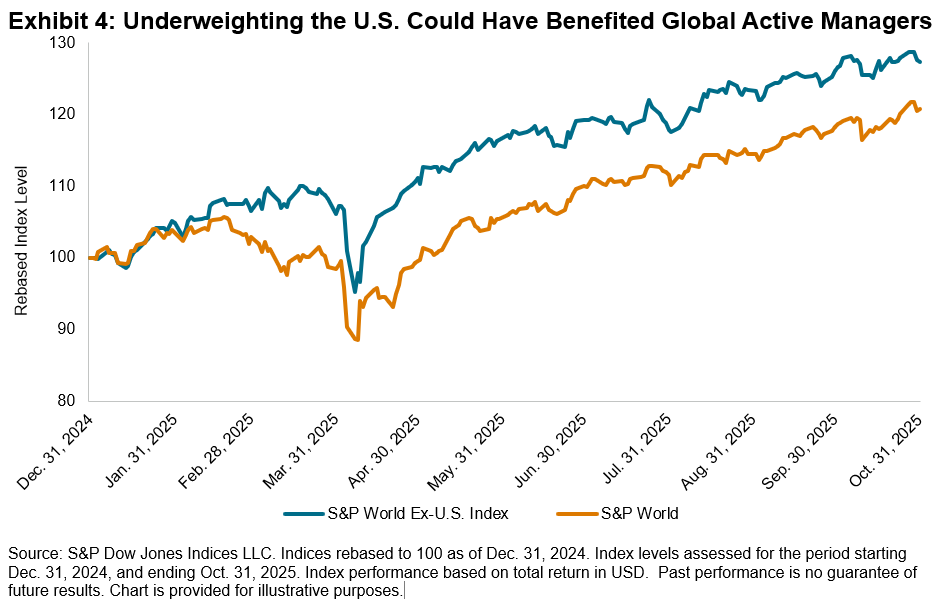
Looking more broadly, in addition to better-than-average prospects for stock selection, regional allocation decisions may have mattered particularly for global equity managers, with the S&P World Ex-U.S. Index outperforming the S&P World by 9% in H1 2025. As observed in Exhibit 4, global fund managers may have benefited from an underweight to the U.S., which makes up 72% of the S&P World’s weight. Despite this tailwind, 58% of global managers still failed to outperform across regions, as demonstrated in Exhibit 1.
H1 2025 was a tale of two markets, while H2 has seen sustained outperformance of large caps, with the S&P 500 Equal Weight Index underperforming the S&P 500 by 6% as of Nov. 6, 2025. This may signal headwinds for active managers who underweight the largest stocks. Meanwhile, the turnaround in U.S. markets, with the S&P World outpacing S&P World Ex-U.S. Index by 2% over the same time period, may portend challenges for international and global equity funds. In the meantime, to find out more about the results of our SPIVA Mid-Year 2025 Scorecards across regions and asset classes, visit our SPIVA Library.
1 Ganti, Anu and Lazzara, Craig, “Shooting the Messenger,” S&P Dow Jones Indices, November 2022.
2 Calculated as the ratio of the number of funds underperforming YTD to the total number of funds at the beginning of the YTD period across all SPIVA regions.
The posts on this blog are opinions, not advice. Please read our Disclaimers.
Advisor Profile: How Direct Indexing SMA Users Evaluate Solutions and Indices

Brandon Hass
Global Head of Client Solutions Group, Direct Indexing and Model Portfolios
S&P Dow Jones Indices
Direct indexing separately managed accounts (SMAs) are gaining traction, especially among financial advisors serving affluent and high-net-worth clients. In their recent whitepaper, Cerulli Associates projects a five-year compound annual growth rate (CAGR) of 16% for direct indexing SMA assets—the highest among all investment vehicles considered.1 In this blog, we unpack what is driving the growth of direct indexing SMAs and examine how advisors who use these solutions evaluate SMAs and their underlying indices.
Why Advisors Utilize Direct Indexing SMAs
Direct indexing SMAs are investment vehicles designed to allow users to track customized versions of well-known indices by owning the securities directly. This direct ownership creates opportunities for tax-loss harvesting, tilting for particular themes and accommodating specific client needs in other ways.
The wide range of potential applications of direct indexing SMAs may help advisors better serve their affluent and high-net-worth clients. Direct indexing SMAs traditionally require higher investment minimums compared to other investment vehicles but enable more optionality than mutual funds or ETFs.
What Matters Most to Advisors Considering Direct Indexing SMAs
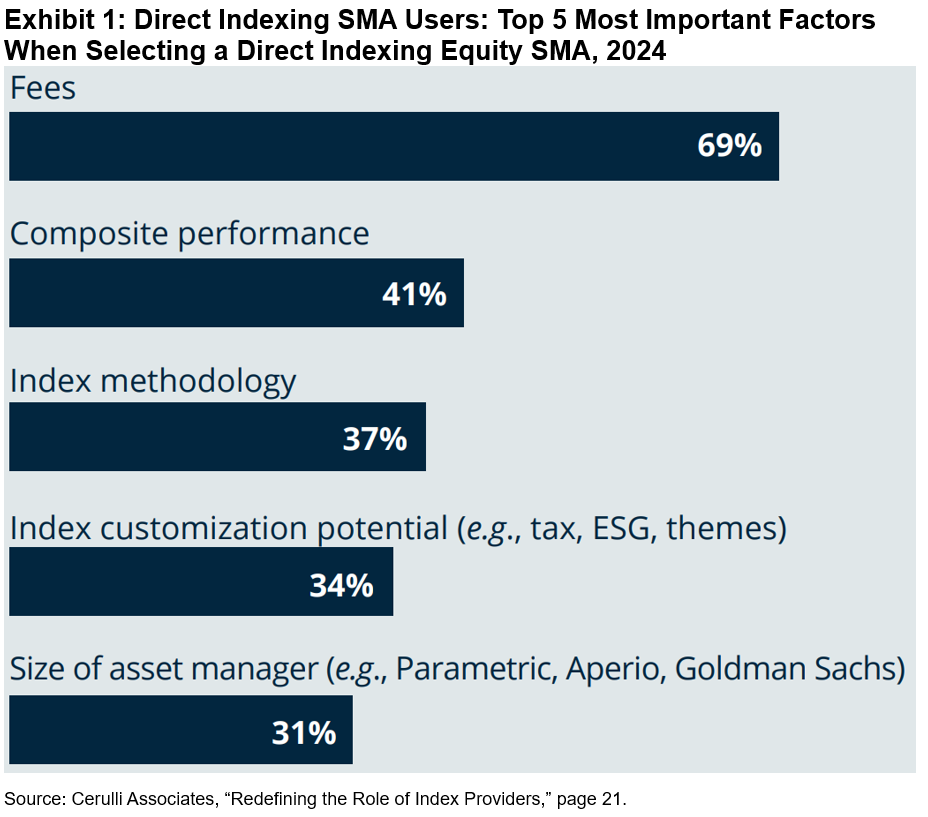
When selecting a direct indexing equity SMA, financial advisors commonly focus on fees (69%), performance (41%), index methodology (37%) and index customization potential (34%), as shown in Exhibit 1.2
These priorities reflect direct indexing SMA users’ focus on cost efficiency, outcomes and the flexibility to shape portfolios around client-specific objectives.
Key Considerations for Evaluating the Underlying Index
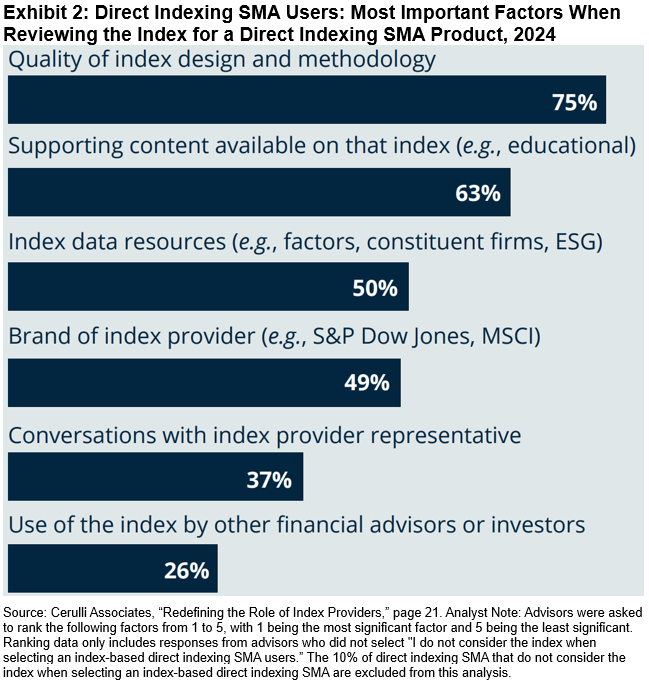
In their review of a direct indexing SMA’s underlying benchmark, financial advisors commonly focus on quality of index design and methodology (75%), supporting content available on that index (63%), index data resources (50%), brand of the index provider (49%) and conversations with an index provider representative (37%), as shown in Exhibit 2.
Index providers with strong brand equity can be an important resource by supplying the above index information to advisors for client conversations. According to Cerulli, most financial advisors using direct indexing SMAs report using index performance data (90%), index design and methodology information (83%), and performance attribution analyses (82%)2—all of which are readily available and accessible from leading index providers.
Index providers “collaborate with us on index design; we use their data and [they] help raise awareness and education for direct indexing,” an executive at an asset manager told Cerulli.3
Cerulli reports that 31% of direct indexing SMA advisors actively engage with index providers, while 35% expect they will engage more in the future.2 This growing trend underscores the potential for index providers to act as a key resource to advisors using direct indexing SMAs as they seek to improve their practices’ functions.
Opportunities for Direct Indexing SMA Users
The survey results suggest that direct indexing SMA users value index providers that can deliver both flexibility and education. Advisors in this segment may need resources that help explain to clients how and why a customized index may align with their objectives.
By providing accessible supporting content, robust data resources and opportunities for direct engagement, index providers offer resources that help these advisors differentiate their practices as direct indexing adoption continues to grow.
To learn more about how financial advisors are using direct indexing SMAs and working with index providers, explore the full Cerulli whitepaper, “Redefining the Role of Index Providers.”
1 The Cerulli Associates whitepaper “Redefining the Role of Index Providers” was sponsored by S&P Dow Jones Indices. Please see page 4.
2 Please see page 21 of Cerulli Associates’ “Redefining the Role of Index Providers.”
3 Please see page 5 of Cerulli Associates’ “Redefining the Role of Index Providers.”
The posts on this blog are opinions, not advice. Please read our Disclaimers.