


The S&P 500® is widely regarded as the best single gauge of U.S. large-cap equities. Among the 500 companies in the index, the largest names have drawn the most attention due to their outperformance in recent years. To address the increasing interest in mega-cap stocks in the S&P 500, S&P DJI recently launched the S&P 500 Top 20 Select Index Series, adding them to our existing offerings of the largest companies in the S&P 500.
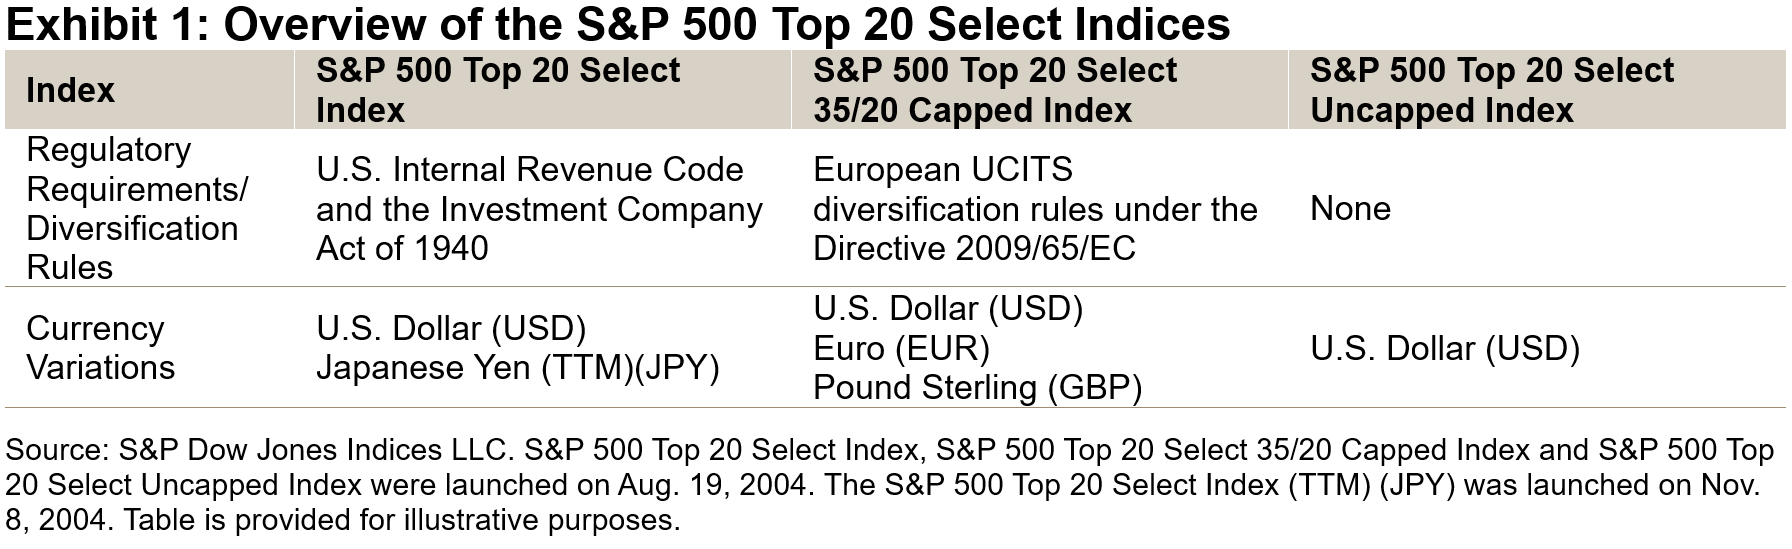
The S&P 500 Top 20 Select Index series currently comprises three headline indices: the S&P 500 Top 20 Select Index, the S&P 500 Top 20 Select 35/20 Capped Index and the S&P 500 Top 20 Select Uncapped Index.
These indices measure the performance of the largest 20 companies in the S&P 500 with different capping mechanisms, which are designed with various diversification requirements in mind. They undergo quarterly reconstitution and rebalancing to reflect the latest market dynamics.1
Why Top 20 Select?
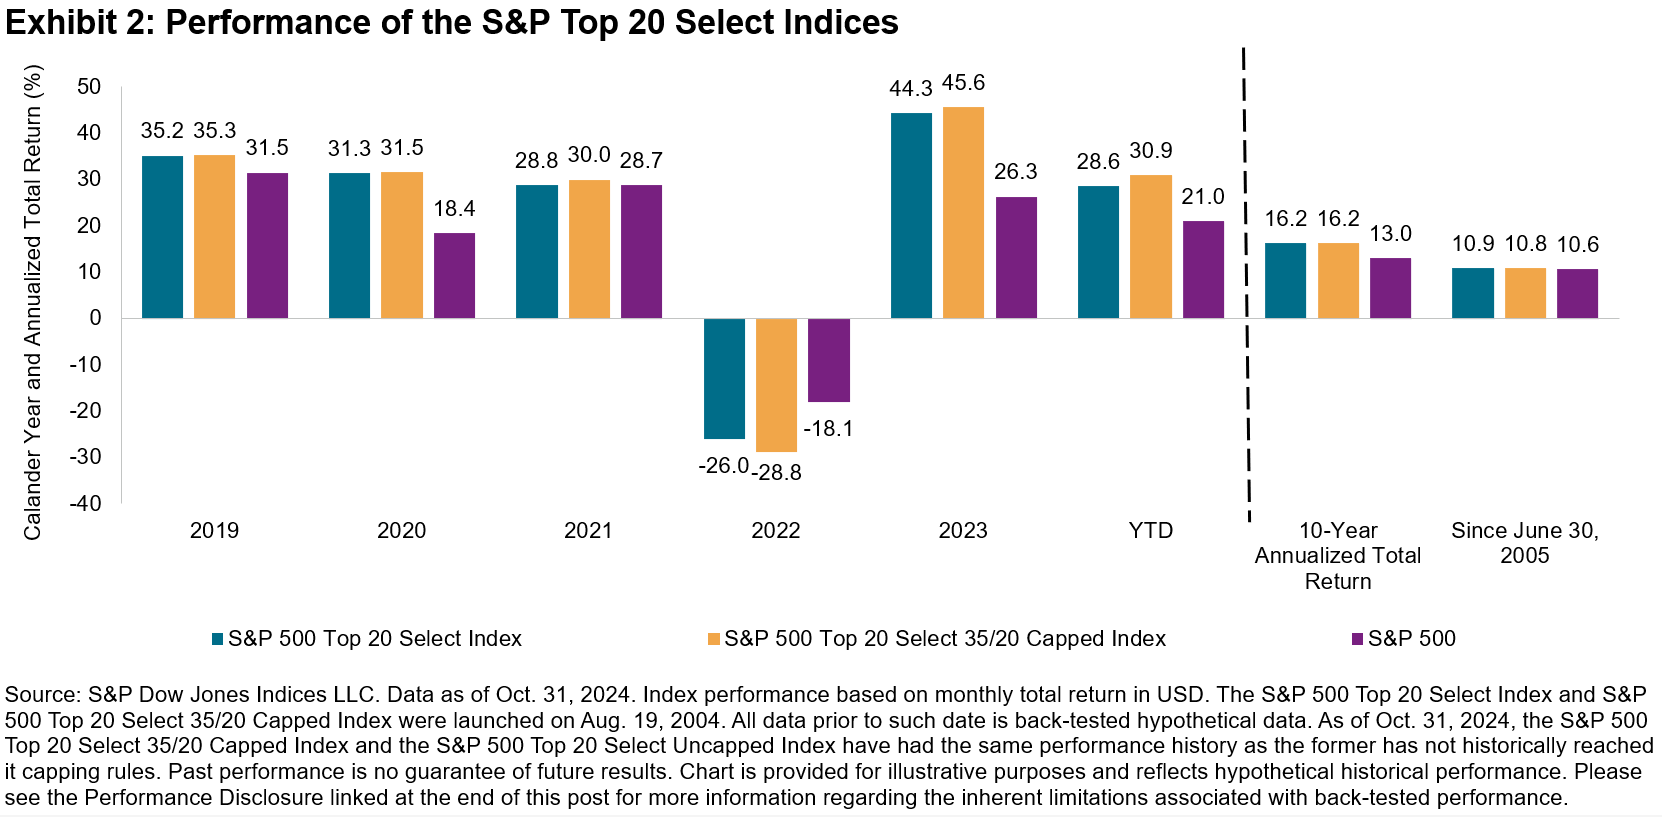
The S&P 500 serves as the benchmark for the large-cap market segment, while the S&P 500 Top 20 Select Index series focuses on the top 4% of the companies by count. The S&P 500 Top 20 Select Index series has outperformed the S&P 500 in the past five years, except for 2022, as well as over longer time horizons (see Exhibit 2).
Generally, a larger market capitalization indicates a company’s leadership within its respective sectors and industries, superior performance relative to its peers, and lower volatility during market turbulence. As of Oct. 31, 2024, the largest 20 companies’ aggregate weight in the S&P 500 was 46%, and they contributed more than 60% of the index’s return YTD.2
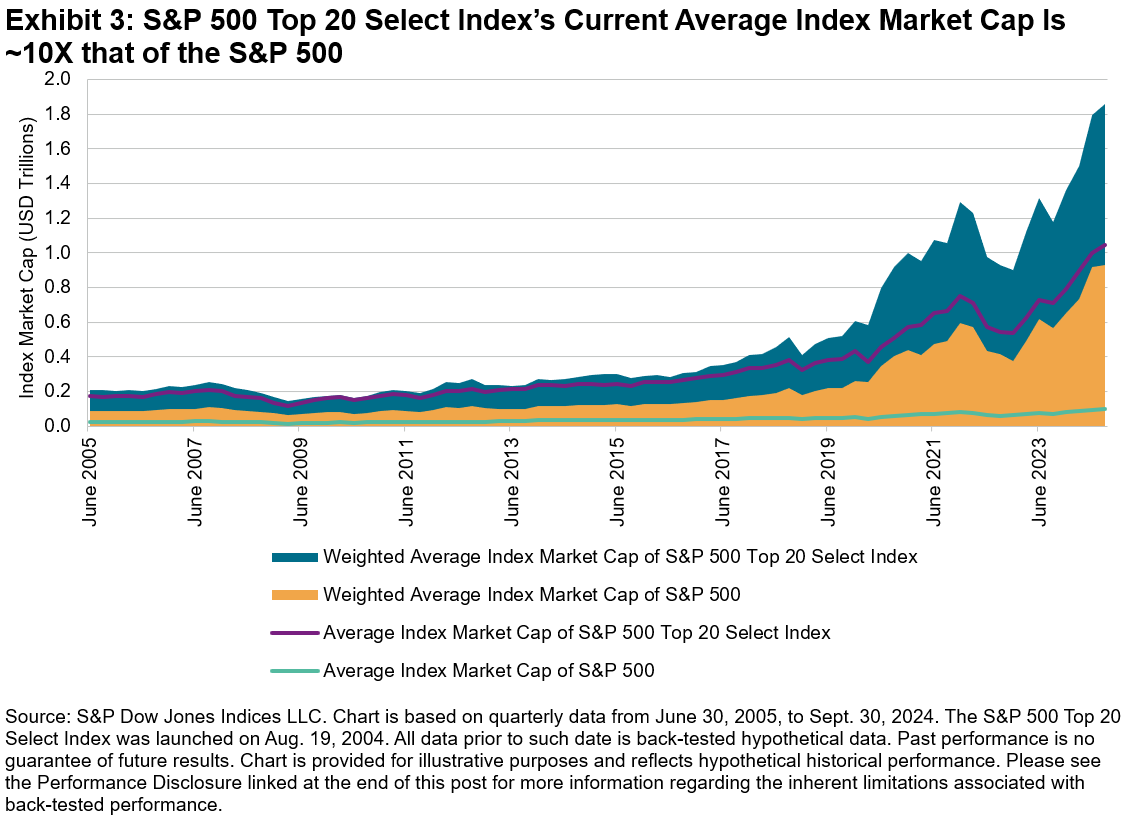
Exhibit 3 shows that the S&P 500 Top 20 Select Index’s weighted average market capitalization has consistently doubled that of the S&P 500 over the past two decades. The divergence between weighted average and simple average market cap of the S&P 500 Top 20 Select Index further highlights the increasing concentration of market value in the largest companies in recent years.
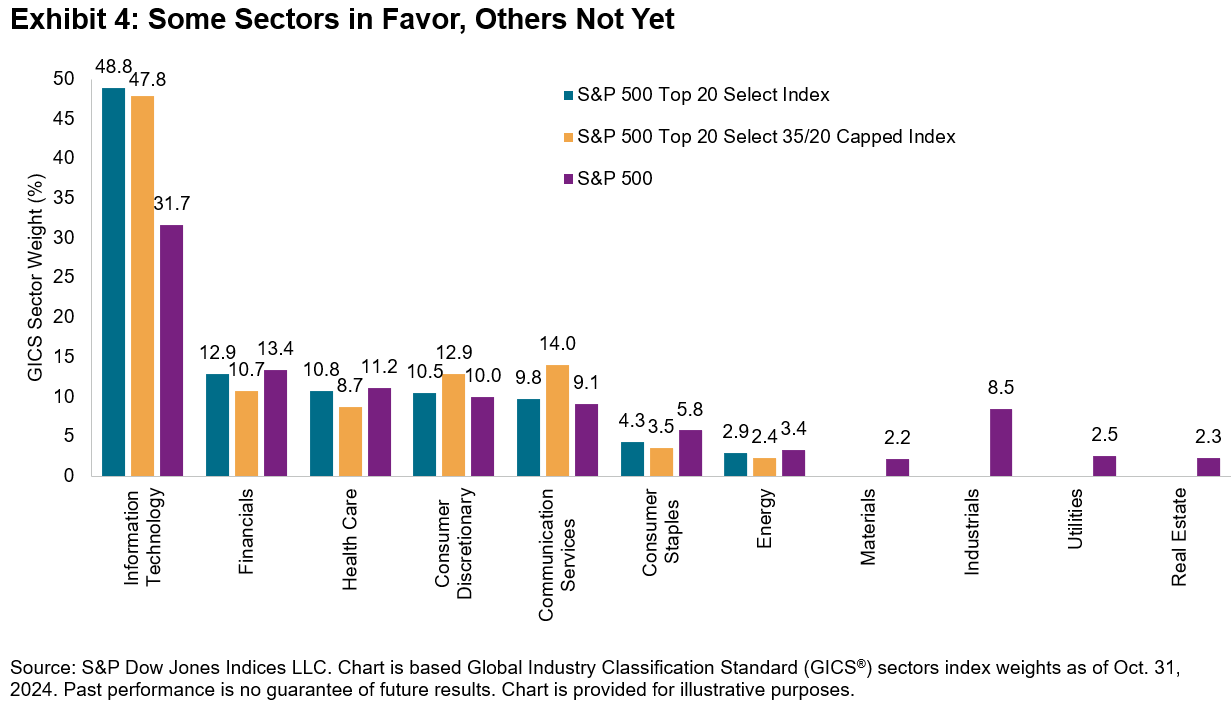
A selection of 20 companies allows sufficient coverage of the best-performing sectors while reducing potential turnovers. For example, Information Technology has been the best-performing sector in recent years, led by Apple, Microsoft and Nvidia. Due to this dynamic, the sector accounted for nearly half of the S&P 500 Top 20 Select Index weight, compared to less than one-third in the S&P 500. The other leading sectors are more comparable with their representations in the S&P 500. In contrast, Materials, Industrials, Utilities and Real Estate are entirely absent, suggesting that these sectors are not favored under the current market conditions (see Exhibit 4).
In our next blog, we’ll explore the S&P 500 Top 20 Select Index’s historical and relative performance.
1 For more information on index construction, please see the S&P U.S. Indices Methodology. For more information on the capping thresholds, please refer to the Regulatory Capping Requirements section of S&P Dow Jones Indices’ Equity Indices Policies & Practices Methodology.
2 Contribution calculation is based on S&P 500 (Total Return). Year-to-date (YTD) data from Dec. 31, 2023, to Oct. 30, 2024. YTD data is not annualized.
The posts on this blog are opinions, not advice. Please read our Disclaimers.


