Get Indexology® Blog updates via email.

In This List

Celebrating 10 Years of the S&P 500 Quality Index

2023 SPIVA Institutional Scorecard: SMAs/Wrap Accounts Are Here!

Fees and Fortunes

The Sector Effect during U.S. Presidential Election Years

An Adaptive Approach to Multi-Asset Diversification

Celebrating 10 Years of the S&P 500 Quality Index

Contributor Image
George Valantasis

Director, Factors and Dividends

S&P Dow Jones Indices

Launched on July 8, 2014, the S&P 500® Quality Index established a framework for identifying high quality companies within the S&P 500. Today, it celebrates a decade of existence as one of the most prominent indices within our factor family. Over the past decade, quality has emerged as a mainstream factor, with significant growth in assets that track the factor. In this blog, we will review the performance of the S&P 500 Quality Index, analyze changes in sector weight and explore the quality characteristics since its inception.

10-Year Performance Review

For the 10-year period ending July 31, 2024, the S&P 500 generated a historically strong 13.14% annualized return (see Exhibit 1). Perhaps even more remarkable, however, is the S&P 500 Quality Index’s 13.28% annualized return, considering its defensive attributes that generally result in lower volatility.

Exhibit 2 displays the annual returns of the S&P 500 and S&P 500 Quality Index since its launch in July 2014. Notably, there have been minimal differences in annual returns over the past decade. However, a significant deviation occurred in the first seven months of this year, with the S&P 500 Quality Index outperforming the S&P 500 by approximately 3.69%.

Sector Weight

Exhibits 3 and 4 display the sector weights of the S&P 500 Quality Index since its inception. Exhibit 3 shows that the sector weights have been consistent. Information Technology had the highest average sector weight at 31.6%, as well as the largest overweight compared to the S&P 500, with a difference of 7.3%. Financials held the largest underweight relative to the S&P 500 at 5.6%, although it still had an average weight of 7.7% over the 10-year period.

Quality Metric Comparison: Then versus Now

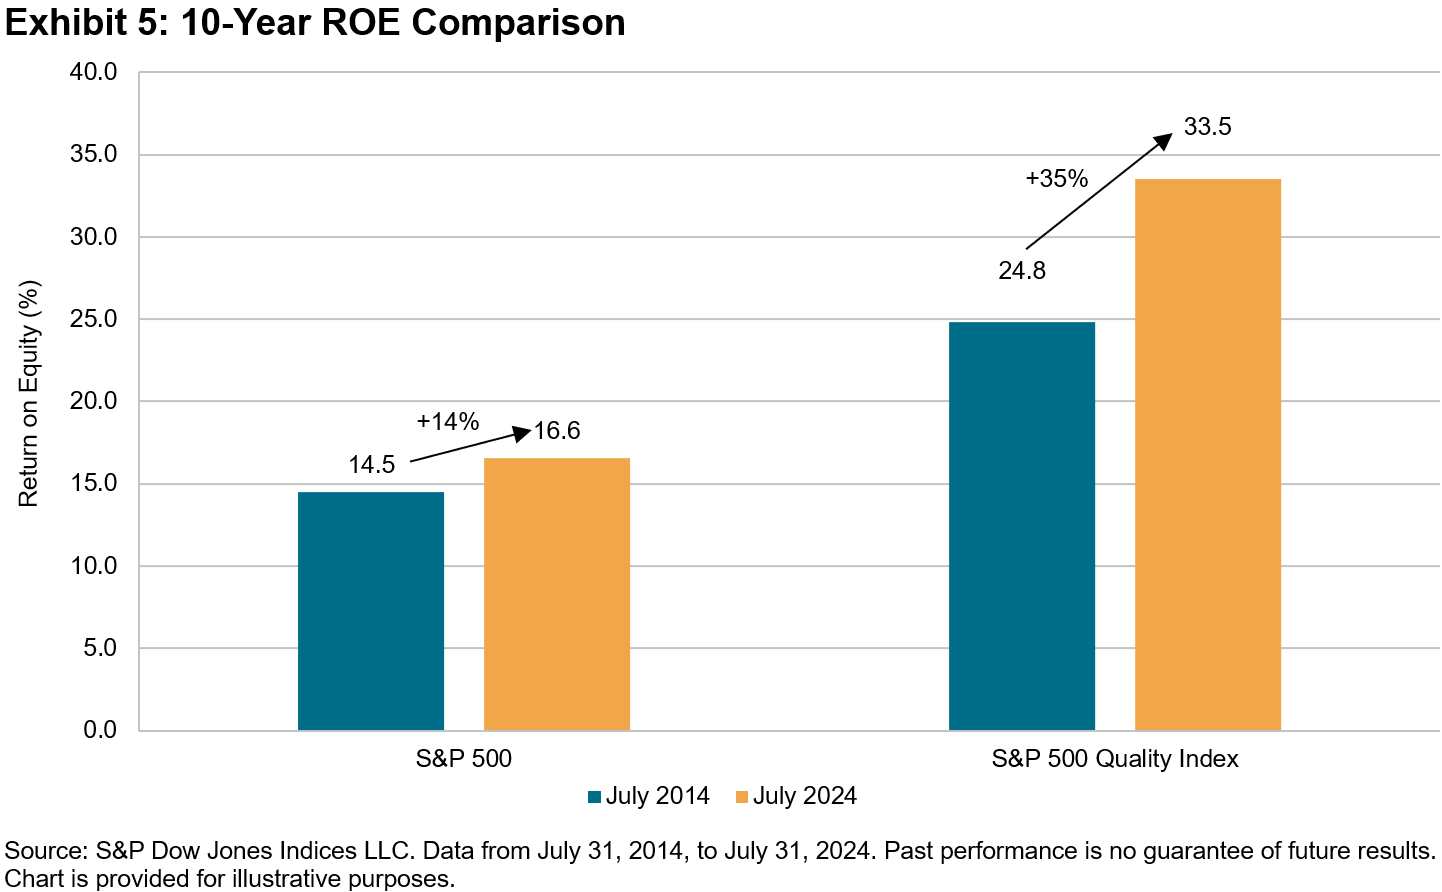
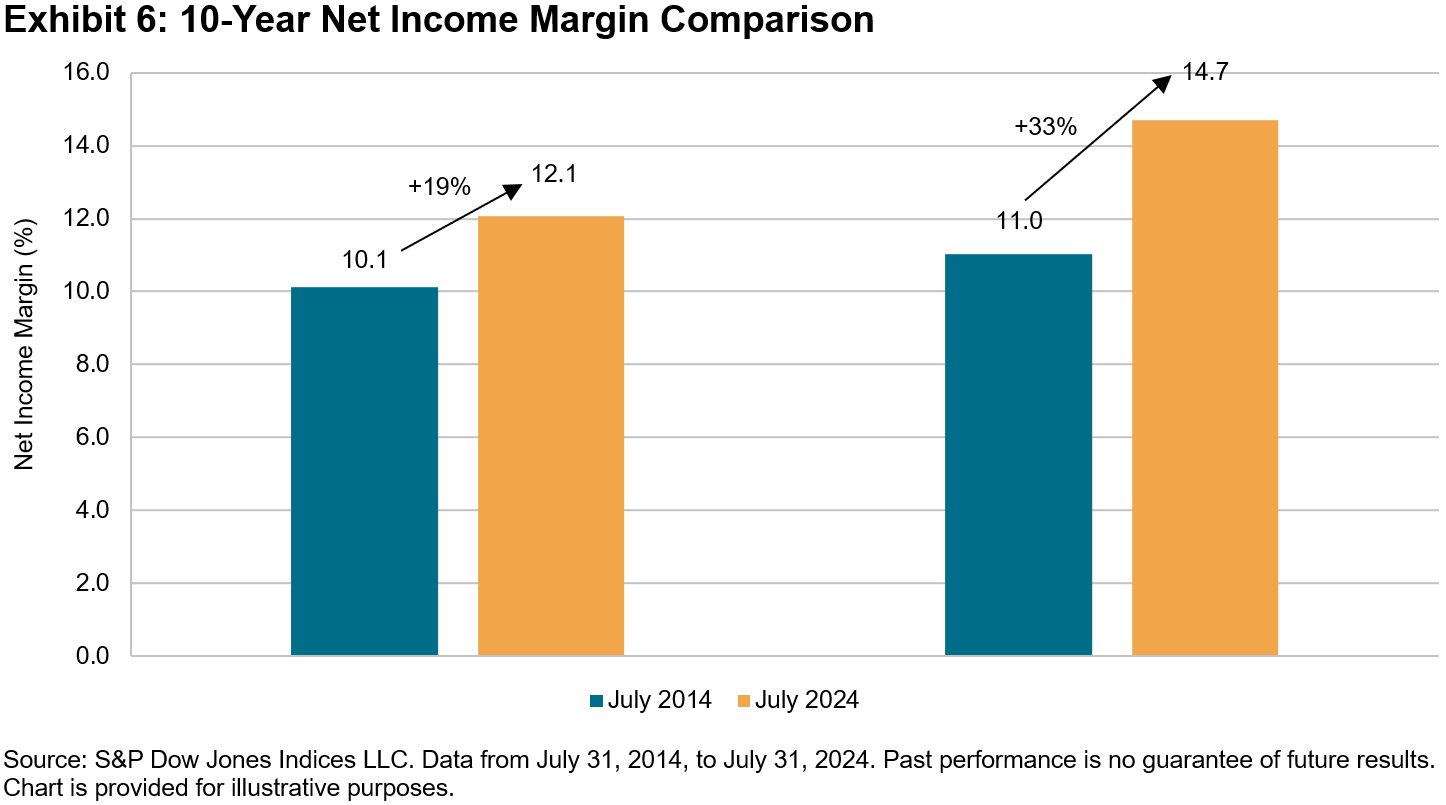
Exhibits 5 and 6 showcase the improved return on equity (ROE) and net income margin of the median constituent of the S&P 500 Quality Index over the last 10 years. The S&P 500 Quality Index’s median constituent increased its ROE from 24.8% to 33.5%, representing a 35% improvement. In comparison, the S&P 500’s median constituent saw a more modest increase in ROE, from 14.5% to 16.6%, representing a 14% improvement. A similar trend is observed in the improvement of net income margin, with the median constituent in the S&P 500 Quality Index improving by 33%, versus 19% for the S&P 500.


Conclusion

Overall, the S&P 500 Quality Index may have exceeded expectations during the predominantly bullish market conditions of the past decade. The index delivered on expectations of providing defensive characteristics in the form of lower volatility and downside capture. Moreover, it achieved this outperformance without substantial sector differences compared to the S&P 500. Not to mention, the strategy’s quality profile improved over this period as well.

The posts on this blog are opinions, not advice. Please read our Disclaimers.

2023 SPIVA Institutional Scorecard: SMAs/Wrap Accounts Are Here!

Contributor Image
Michael Brower

Former Associate Director, Index Investment Strategy

S&P Dow Jones Indices

First published in 2002, the S&P Indices versus Active (SPIVA®) U.S. Scorecard measures the performance of active mutual fund managers against their respective S&P DJI benchmarks over various time horizons and across asset classes. In 2015, we extended the analysis to include institutional accounts to understand how institutional asset owners fared versus mutual funds against their respective benchmarks and the impact of fees on performance.

In our 2023 edition, we have further expanded our purview of assessing active manager performance to now include separately managed accounts (SMAs)/wrap accounts. SMAs may offer potential benefits such as increased customization, greater transparency and direct ownership of securities in a portfolio. With the addition of these accounts, we can examine the performance of professionally managed portfolios held by retail investors against their respective benchmarks.

Our reported SMA/wrap categories span across equities and fixed income. In 2023, in our most closely watched category of All Large-Cap Funds, 72% of SMA/wrap managers underperformed the S&P 500® on a gross-of-fees basis, lagging their institutional account and mutual fund peers (see Exhibit 1).  Large-cap managers may have been hampered by the dominance of mega-cap stocks, especially if they were underweighted in comparison to their benchmark weights.

In contrast, mid- and small-cap managers fared much better. Only 42% of mid-cap and 30% of small-cap managers underperformed their respective benchmarks. One potential explanation for these results may be style bias opportunities among smaller-cap managers, who may have benefited by taking strategic tilts toward outperforming larger-cap stocks, with the S&P 500 outperforming the S&P MidCap 400® and the S&P SmallCap 600® by 9.9% and 10.2%, respectively.

Style bias often explains performance across the capitalization spectrum; it may be easier for small- and mid-cap managers to tilt their portfolios toward larger companies with greater liquidity or to let their winners run. Historically, the odds of success for mid- and small-cap managers have improved when larger stocks have outperformed, with majority outperformance for small-cap mutual funds in 7 out of the past 22 years, of which 6 years coincided with large-cap outperformance.

SMA/wrap results within fixed income were mixed in 2023 across our three reported categories (see Exhibit 2). U.S. Aggregate accounts posted majority outperformance, followed by a moderate showing for Core, with 51% of accounts underperforming, and bleaker results within the muni space, with 86% of Municipal accounts underperforming the S&P National AMT-Free Municipal Bond Index.

While there were a few categories with majority outperformance in 2023, our SPIVA scorecards have consistently shown that outperforming a benchmark over time is challenging, and this continues to ring true for SMAs/wrap accounts. Exhibits 1 and 2 show that more than 70% of accounts across equity SMA/wrap categories and more than 50% across fixed income categories underperformed their respective benchmarks over the 10-year period ending Dec. 31, 2023. For more detailed information on how SMAs/wrap accounts fared last year, please see our 2023 SPIVA Institutional Scorecard.

The author would like to thank Anu Ganti and Davide Di Gioia for their contributions to this post.

The posts on this blog are opinions, not advice. Please read our Disclaimers.

Fees and Fortunes

Contributor Image
Anu Ganti

Head of U.S. Index Investment Strategy

S&P Dow Jones Indices

One of the potential advantages of indexing is its typically lower cost relative to active management. Investors have benefited substantially by saving on fees. And as indexing has expanded across asset classes, these rewards have compounded, especially in fixed income, where fees can prove more influential.

In Exhibit 1, we see that index mutual fund expense ratios in the U.S. have been consistently lower than their active counterparts for the past couple of decades. Although that spread has narrowed in recent years, we still observe a fee differential of 60 bps across equities and 41 bps across bonds as of 2023.

Exhibit 1- Passive Equity and Bond Mutual Fund Expense Ratios Are Significantly Lower than Active

In addition to fee savings, index-tracking investors may have also benefited by avoiding active underperformance. Particularly germane to the equity markets, our SPIVA® Scorecards show that only a handful of actively managed mutual funds have outperformed the benchmark. But how do we account for institutional investors who, unlike retail investors, claim an advantage in selecting skillful asset managers coupled with a better vantage point to negotiate fees?

Our SPIVA Institutional Scorecard seeks to shed light on these questions, providing coverage of the performance of institutional accounts along with mutual fund data from the flagship SPIVA U.S. Scorecard. Exhibit 2 plots the differential in 10-year underperformance rates between institutional accounts versus mutual funds on both a net and gross-of-fees basis.

The chart illustrates several notable observations. First, long-term net-of-fees performance for institutional accounts was better compared to mutual funds in 20 out of 21 reported equity segments, with International Small-Cap Funds a noticeable outlier. Second, gross-of-fees relative performance for institutional accounts was better for 17 out of 21 equity categories. Third, except for a few categories, differences between mutual fund and institutional account underperformance rates were generally negligible, with majority underperformance for institutional accounts across all categories, on both a gross and net-of-fees basis.

Exhibit 2- Differences between Institutional Account and Mutual Fund 10-Year Underperformance Rates Were Generally Negligible across Most Equity Categories

While long-term results may slightly favor institutional accounts versus mutual funds, results can vary over the short term. In our most closely watched category, All Large-Cap Funds, 66% of institutional accounts underperformed the S&P 500® in 2023, worse than the 60% rate we observed for active large-cap mutual funds. Consistent 10-year majority underperformance rates across categories highlight the challenges of outperformance and show that institutional investors are no exception to the rule. Find out more about how institutional equity and fixed income managers fared last year in our SPIVA Institutional Year-End 2023 Scorecard.

The posts on this blog are opinions, not advice. Please read our Disclaimers.

The Sector Effect during U.S. Presidential Election Years

History suggests that sectors have a greater potential to over- and underperform during U.S. presidential election years. Join S&P DJI’s Ed Ware, Anu Ganti and Hamish Preston for a closer look at some of the drivers behind election years’ tendency to offer greater sector outperformance opportunities than non-election years.


The posts on this blog are opinions, not advice. Please read our Disclaimers.

An Adaptive Approach to Multi-Asset Diversification

A static approach to multi-asset index construction may be slow to react to changing markets. Discover how the S&P 500 Market Agility 10 TCA Index dynamically manages its allocations to stocks and bonds to respond rapidly to market movements and yield curve trends.

The posts on this blog are opinions, not advice. Please read our Disclaimers.