Get Indexology® Blog updates via email.

In This List

Balancing Defense with Growth (Part II): The S&P Quality Developed Ex-U.S. LargeMidCap

The February 2024 Rebalance of the S&P 500 Low Volatility Index

U.S. Sector Relevance to China

Navigating Private Credit Liquidity Challenges with Indices

Food Inflation Bites into Income as Commodities March Higher

Balancing Defense with Growth (Part II): The S&P Quality Developed Ex-U.S. LargeMidCap

Contributor Image
Wenli Bill Hao

Director, Factors and Dividends Indices, Product Management and Development

S&P Dow Jones Indices

As investments in artificial intelligence continue to boom, major indices in the U.S., Europe and Japan have hit all-time highs. In our previous blog, we reviewed how the S&P U.S. Quality Indices outperformed their corresponding benchmarks over both the short and the long term. Similarly, a quality premium also exists in developed ex-U.S. equity markets. As shown in Exhibit 1, for the one-year period from Jan. 31, 2023, to Jan. 31, 2024, the S&P Quality Developed Ex-U.S. LargeMidCap outperformed its benchmark by a decent margin. In this blog, we investigate the index’s design, performance, characteristics and attribution.

Quality Metrics and Index Design

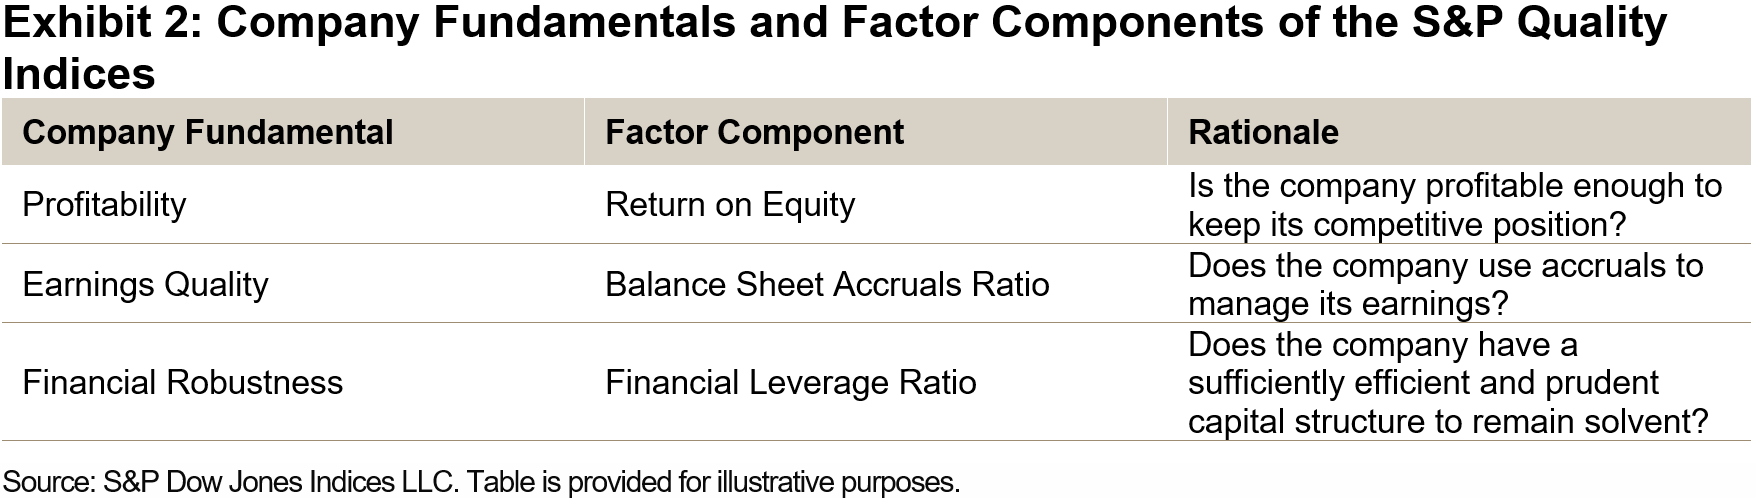
The S&P Quality Developed Ex-U.S. LargeMidCap utilizes the same three prominent metrics as the S&P U.S. Quality Indices. These metrics aim to capture a company’s quality characteristics: strong profitability, high earnings quality and robust financial strength (see Exhibit 2). The index constituents correspond to the top 20% of eligible stocks within the S&P Developed Ex-U.S. LargeMidCap’s universe, ranked by their overall quality scores. These constituents are weighted by the product of their market capitalization and quality scores, subject to country (maximum 40%), sector (maximum 40%) and individual (maximum 5%) holding constraints.1

Performance Comparison

Historically, the S&P Quality Developed Ex-U.S. LargeMidCap has outperformed its benchmark over the short and the long term with respect to total return and risk-adjusted return (see Exhibit 3). Additionally, the quality strategy has tended to exhibit defensive qualities, as evidenced by lower beta and smaller drawdowns.

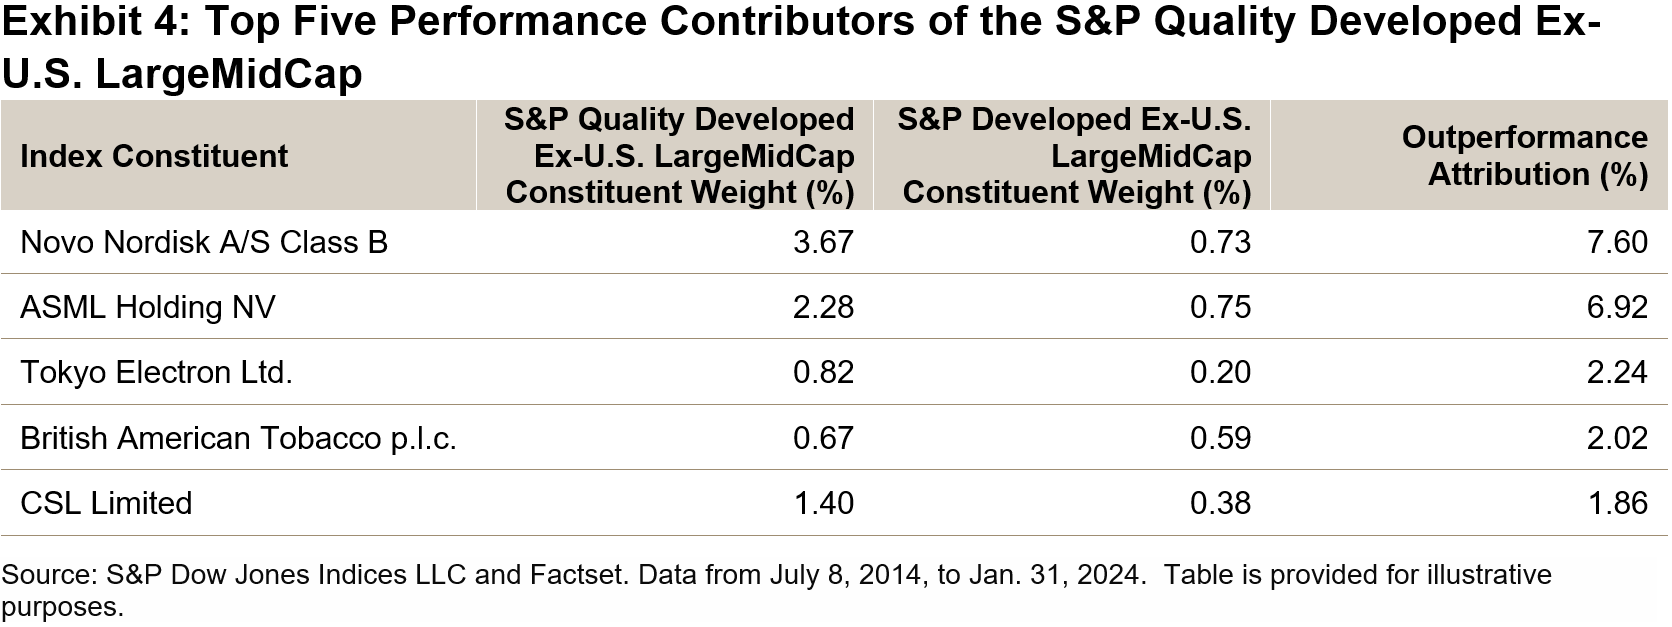
From its launch on July 8, 2014, to Jan. 31, 2024, the S&P Quality Developed Ex-U.S. LargeMidCap had a cumulative return of 71.19% (with an annualized volatility of 14.3%) versus a cumulative return of 51.87% (with an annualized volatility of 14.2%) for its benchmark. The outperformance of 19.32% was mainly from the top five contributors that were largely from the Information Technology and Health Care sectors (see Exhibit 4).

High Upside Participation and Defensive Characteristics

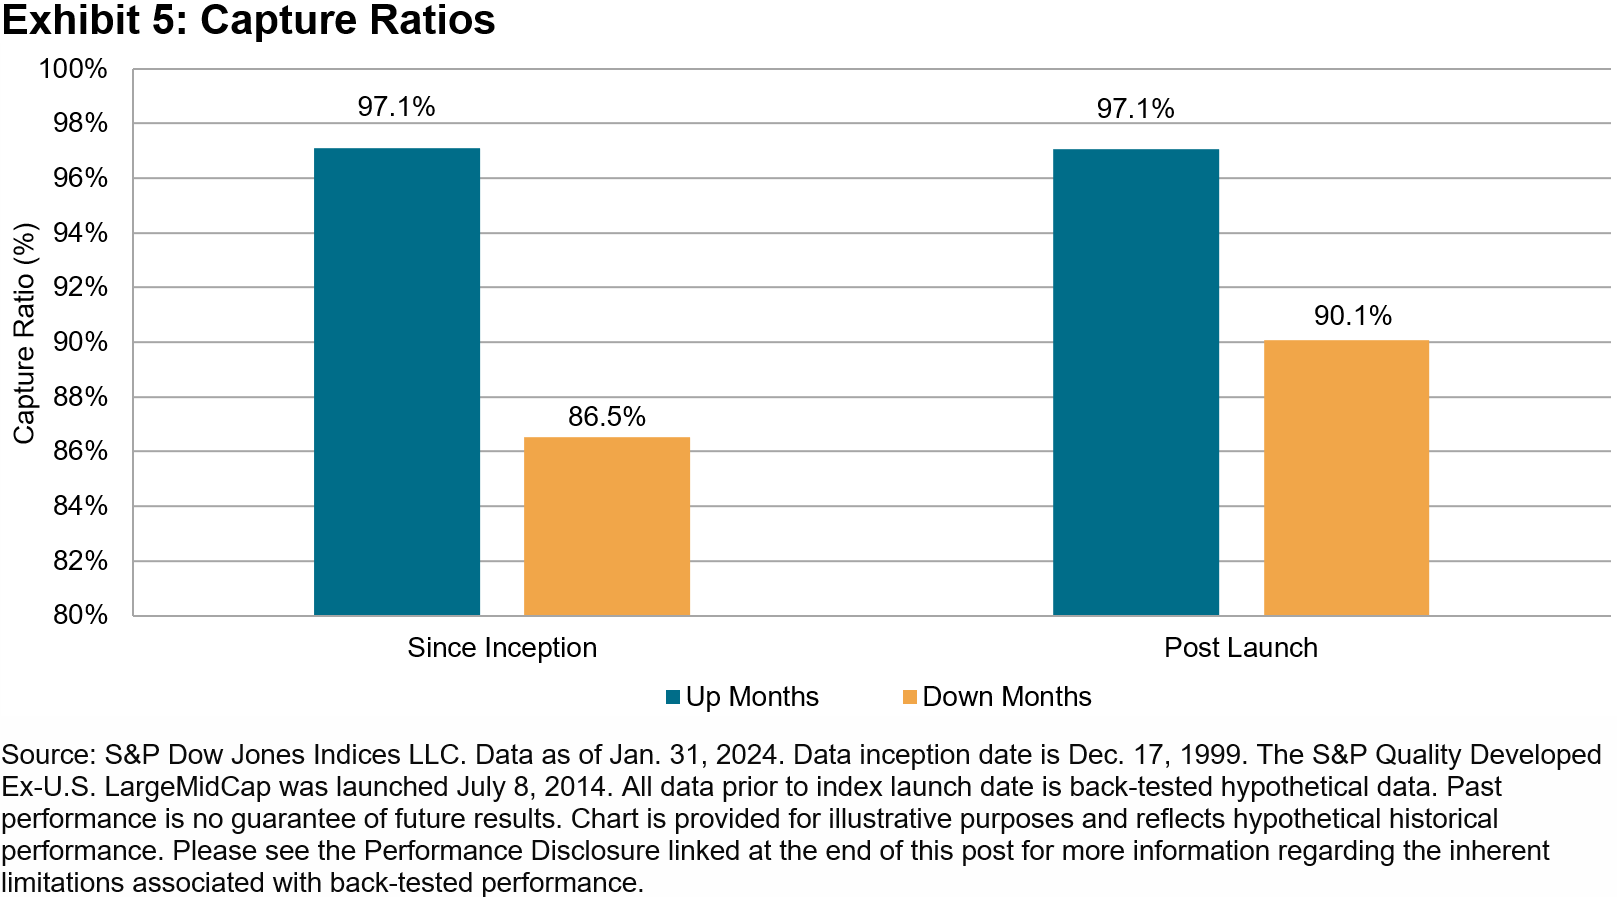
The historical capture ratios in Exhibit 5 show that the S&P Quality Developed Ex-U.S. LargeMidCap tended to participate one-for-one in up markets,2 while delivering significant outperformance during down markets. Such features held true for the whole period since the index inception date and post-launch period. These unique characteristics make sense, since quality indices are designed to track companies with durable business models and sustainable competitive advantages.

Country Exposure

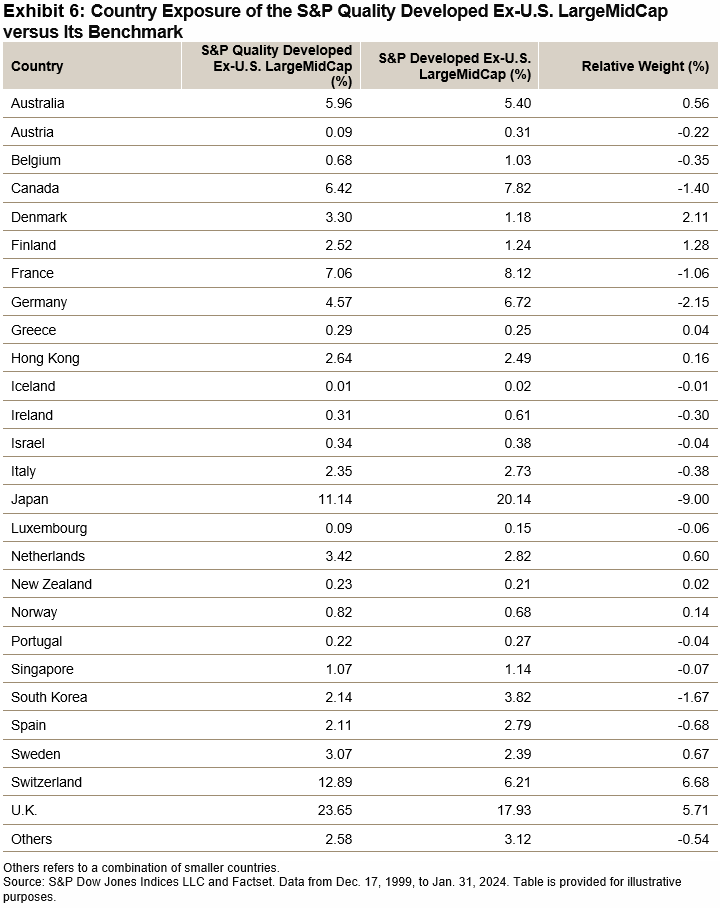
In Exhibit 6, we investigate the country allocation of the constituents in the S&P Quality Developed Ex-U.S. LargeMidCap and its benchmark. From Dec. 17, 1999, to Jan. 31, 2024, the index mainly overweighted Switzerland (6.68%) and the U.K. (5.71%) while underweighting Japan (-9.00%) and Germany (-2.15%).
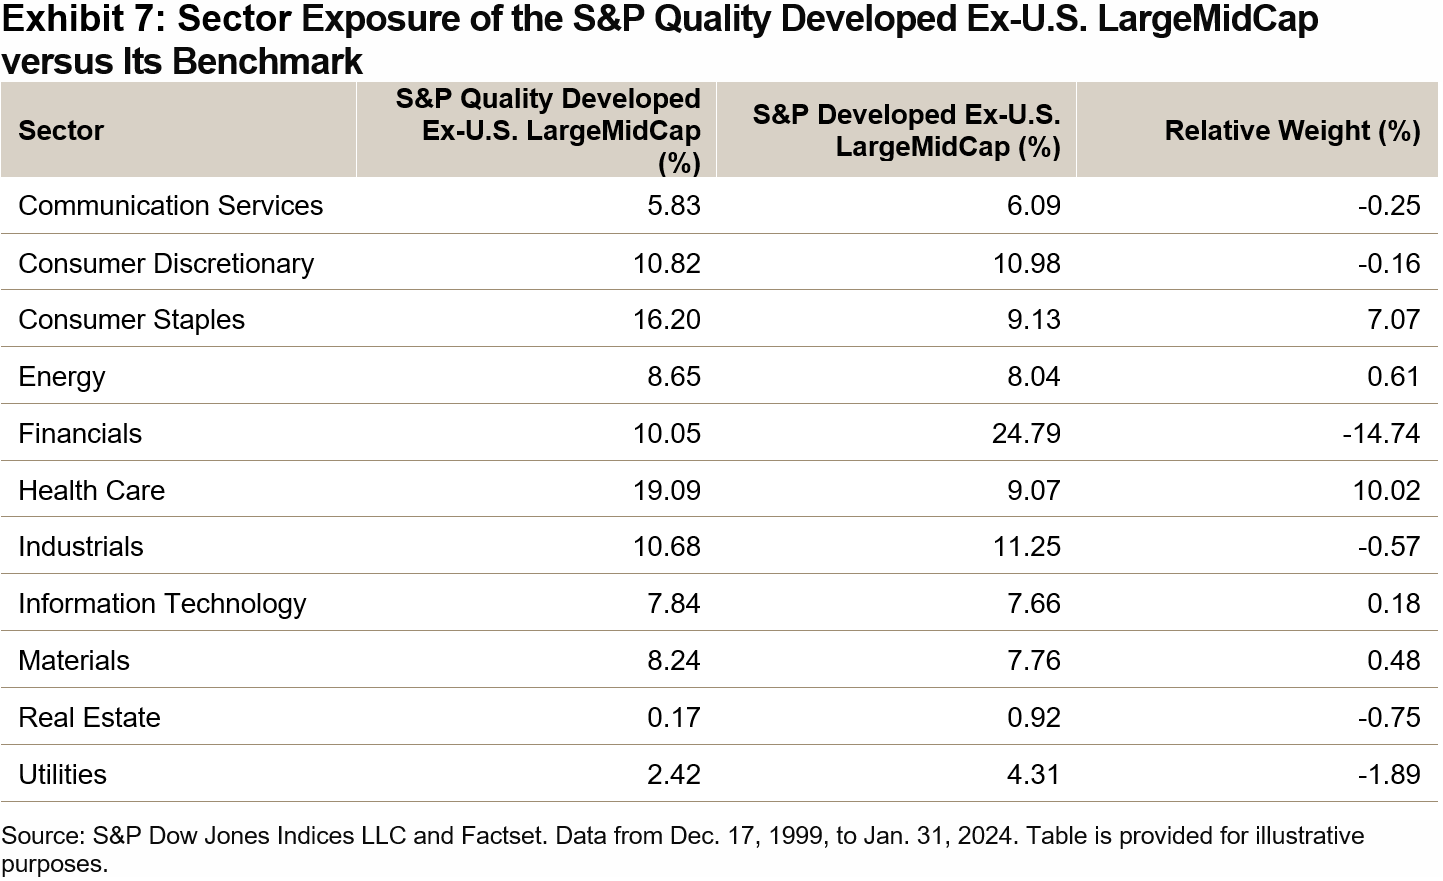
Sector Exposure

We next explore the sector exposure of the S&P Quality Developed Ex-U.S. LargeMidCap. As seen in Exhibit 7, the index historically has had a significant overweight in Health Care (10.02%) relative to its benchmark, with a large underweight in Financials (-14.74%).
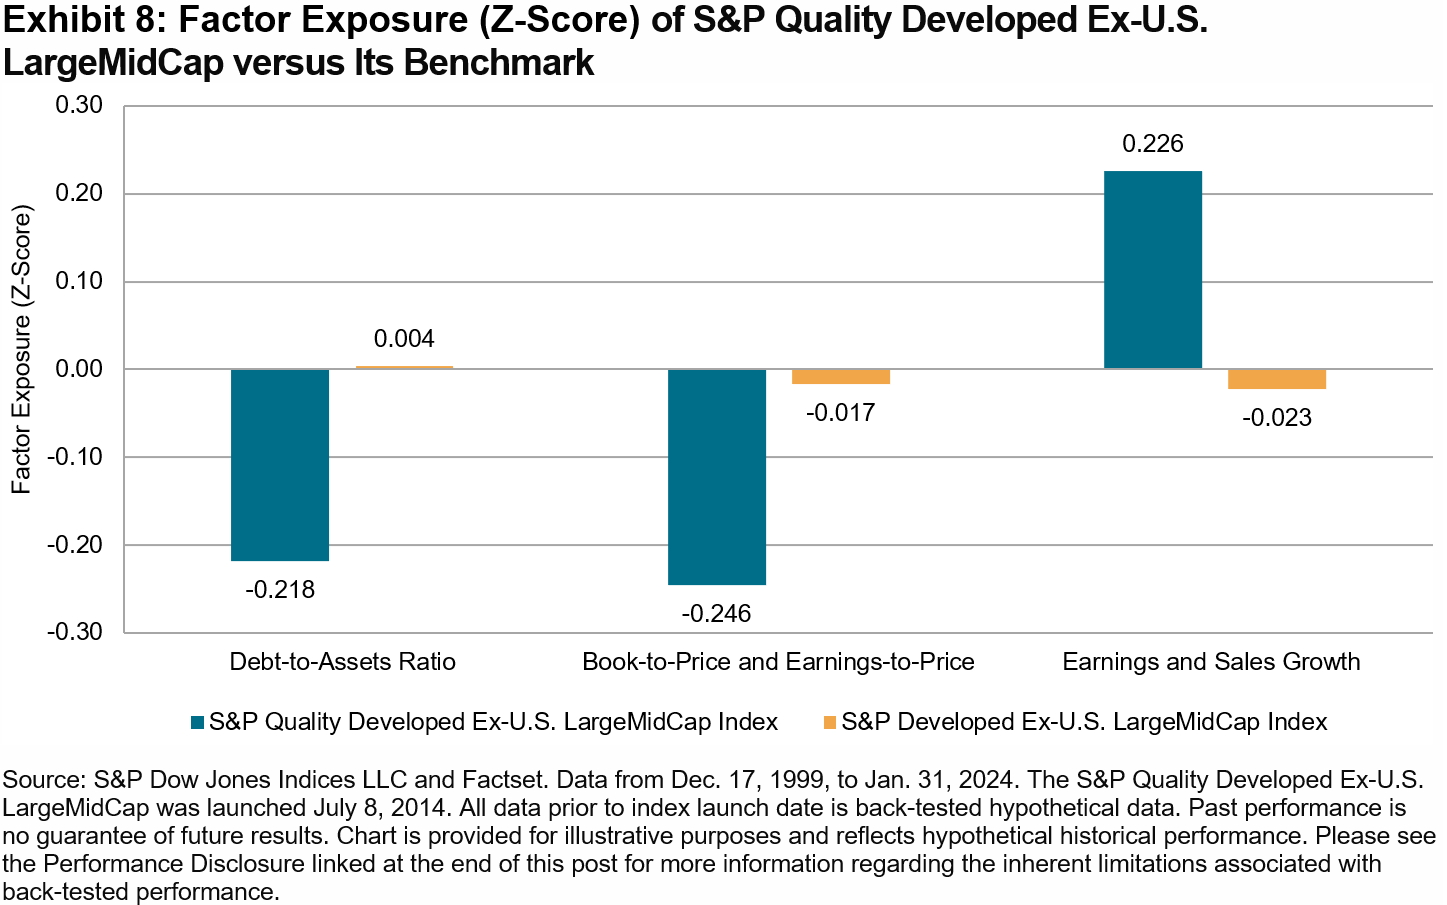
Factor Exposure

Exhibit 8 shows the factor exposure of the S&P Quality Developed Ex-U.S. LargeMidCap versus its benchmark in terms of the Axioma World-Wide Ex-US Risk Model3 Factor Z-scores. The quality index demonstrated strong quality and growth tilts versus its benchmark. Specifically, the quality index had lower exposures to leverage ratio and value factors, with a higher exposure to growth than its benchmark.

1 For further information about the factor definition, factor score calculation and index design, please see the S&P Quality Indices Methodology.

2 The market is defined as the monthly performance of the underlying benchmark from Dec. 31, 1994, to July 31, 2023.

3 The Axioma World-Wide Ex-US Equity Factor Risk Model does not have a style factor for profitability.

The posts on this blog are opinions, not advice. Please read our Disclaimers.

The February 2024 Rebalance of the S&P 500 Low Volatility Index

Contributor Image
George Valantasis

Associate Director, Factors and Dividends

S&P Dow Jones Indices

Since the previous rebalance for the S&P 500® Low Volatility Index on Nov. 17, 2023, and its most recent on Feb. 16, 2024, the S&P 500 delivered a stunning 11.3% return. During this period, the S&P 500 Low Volatility Index was up 5.3%, strong by historical standards, albeit underperforming the S&P 500. As has been the trend recently, the S&P 500 Low Volatility Index historically tends to underperform during periods of low volatility for the S&P 500. Over this period, the annualized daily standard deviation for the S&P 500 was just 10.1%.

As Exhibit 2 shows, trailing one-year volatility decreased for all GICS sectors except for Industrials as of Jan. 31, 2024, versus Oct. 31, 2023. The widespread decline in volatility continued the trend that took place throughout most of 2023. Measured in absolute terms, the sectors with the largest declines in volatility were Consumer Discretionary, Communication Services and Materials, which dropped by 3.6%, 2.9% and 2.7%, respectively. Industrials was the only sector with an increase in volatility, rising from 15.9% to 19.0%.

Amid the overall decrease in volatility, the S&P 500 Low Volatility Index’s latest rebalance brought changes to sector weightings, although the changes were more muted than recent rebalances. Consumer Staples lost 2.4%, the most of any sector, although it retained its position as the highest-weighted sector, at 23.4%. The largest recipients were Information Technology and Health Care, receiving 1.8% and 1.4%, respectively. Materials received a 1.0% allocation, resulting in all 11 GICS sectors now being represented in the S&P 500 Low Volatility Index. The latest rebalance was effective after the market close on Feb. 16, 2024.


The posts on this blog are opinions, not advice. Please read our Disclaimers.

U.S. Sector Relevance to China

Contributor Image
Fei Wang

Senior Analyst, U.S. Equity Indices

S&P Dow Jones Indices

Chinese investors tend to exhibit high exposures to domestic equities. Incorporating U.S. equities could help Chinese investors diversify their strategies and alleviate home-country bias. For example, the S&P 500® may be relevant for exposure and sensitivity to the U.S. economy. Additionally, market participants seeking to offset domestic equity biases or express tactical views may wish to consider the potential applications of the S&P 500 sector indices.

The representation of U.S. equities in global equity markets underscores the importance of a U.S. perspective when looking to express views on various sectors. Exhibit 1 shows the proportion of each GICS® sector represented by companies domiciled in different parts of the world. Specifically, U.S.-domiciled companies accounted for most of the market capitalization in 10 out of the 11 global sectors.

Moreover, the breadth and depth of the U.S. equities market means that the size of S&P 500 sectors is comparable to many countries. For instance, as of Jan. 31, 2024, the market capitalization of the S&P 500 Information Technology (USD 12 trillion) was second only to the entire U.S. market in the S&P Global BMI (USD 50 trillion). The S&P 500 Financials and S&P 500 Health Care are comparable in size to the Japanese market. The size of U.S. sector segments means that expressing views through a sector lens could have presented similar opportunities—as measured by market size or capacity-adjusted dispersion—as expressing views through a country lens, historically.

The S&P Select Sector 15/60 Capped Indices measure the performance of S&P 500 companies across the 11 GICS sectors, while employing a capping mechanism that limits the weight of the largest companies in the index. These U.S. sector indices could help Chinese investors diversify their strategies, especially when the domestic market is underperforming.

In recent years, China has grappled with a slower-than-expected recovery from the COVID-19 pandemic and encountered various internal and external challenges. During the same period, however, certain U.S. sectors showcased remarkable resilience and delivered substantial returns. For example, the S&P Communication Services Select Sector 15/60 Capped Index, which experienced a larger decline than the S&P China BMI in 2022 (-34% versus -22%, respectively), rebounded with a 42% return in 2023, while the S&P China BMI saw an additional 10% drop.

Historical evidence highlights the potential value of utilizing sectors to express views on the U.S. Presidential election, as investors often factor in the anticipated impact of candidates’ policies on various market segments. The 2016 election saw a significant divergence between the best- and worst-performing sectors, emphasizing the potential value of expressing views through a sector lens. More recently, sector performance around the 2020 election was influenced by several dynamics, including surging oil prices which helped Energy companies to outperform (see Exhibit 4).

As we approach the end of 2024, a new round of the presidential election is underway. Given the prevailing global and U.S. conditions, Chinese investors could still leverage U.S. sectors to convey their perspectives on the potential impacts of the election.

Overall, U.S. sectors represent significant market segments and could offer opportunities that Chinese investors may not want to overlook, whether for global equities exposure or tactical strategies. The upcoming presidential election further provides a platform for investors to express views on U.S. matters, adding an additional dimension to the strategic considerations for Chinese investors.

The posts on this blog are opinions, not advice. Please read our Disclaimers.

Navigating Private Credit Liquidity Challenges with Indices

What’s driving insurance companies’ increased allocation to private credit?  S&P Global Market Intelligence’s Lynn Bachstetter joins S&P DJI’s Frans Scheepers and State Street Global Advisors’ Bill Ahmuty to explore how indices like the iBoxx Liquid Leveraged Loan Index are helping insurers identify and navigate liquidity challenges in private credit markets.

The posts on this blog are opinions, not advice. Please read our Disclaimers.

Food Inflation Bites into Income as Commodities March Higher

Contributor Image
Brian Luke

Senior Director, Head of Commodities, Real & Digital Assets

S&P Dow Jones Indices

Inflation continues to impact consumers and policymakers in negative ways. Hedging through broad commodities has proven to buffer portfolio returns, with the S&P GSCI up 5.38% this year. Going into the year, expectations of Fed rate cuts and continued declines in the Consumer Price Index (CPI) pushed inflation concerns aside. Since then, markets have experienced increased inflation figures and downsized rate cut bets. Commodities make up over one-third of the CPI, providing a direct hedge against upside inflation surprises. Americans have been spending more on food as a percentage of disposable income since the 1980s. The USDA’s most recent report1 highlights that 11.3% of income is being spent on food. The Fed may overlook volatile food and energy, preferring to focus on the Personal Consumption Expenditures Index (PCE), but even the PCE has followed the traditional CPI levels in its trend higher. More importantly, the S&P GSCI has historically tended to outperform when inflation surprises to the upside.

Fueled by hedge fund speculation, cocoa prices surged over 32% during the month to an all-time high and futures markets reported USD 8.7 billion in speculative cocoa contracts. Political instability and declining crop yields in West Africa cast a similar picture last seen during the 2001 bull run-up in cocoa, the best year on record dating back to 1984. On the heels of a 61% return in 2023, cocoa is up an additional 51% in 2024, even outperforming the S&P Bitcoin Index, which is up a paltry 47.5%.


1 https://www.ers.usda.gov/data-products/ag-and-food-statistics-charting-the-essentials/food-prices-and-spending/?topicId=2b168260-a717-4708-a264-cb354e815c67

The posts on this blog are opinions, not advice. Please read our Disclaimers.