


What happens to index performance and diversification when sectors and sustainability are combined? S&P DJI’s Stephanie Rowton and Invesco’s Chris Mellor discuss how new index-based tools are helping market participants track a diverse mix of companies with strong sustainability credentials.
The posts on this blog are opinions, not advice. Please read our Disclaimers.Combining Sectors and Sustainability
S&P/ASX Small- and Mid-Cap Indices: Differentiators in a Large-Cap Dominated Market
The Best of Both Worlds: Sustainability in Sectors
Lessons from 20 Years of Equal Weight
The S&P GSCI Cooled in April as Inflation Cooled
Combining Sectors and Sustainability
S&P/ASX Small- and Mid-Cap Indices: Differentiators in a Large-Cap Dominated Market

Large-cap, Australian-listed companies have continued their robust 2022, outperforming the small- and mid-cap segments YTD as of April 30, 2023. However, a fast-changing economic environment may support considering small and mid-cap indices in Australia.
The range of returns for Australian-listed companies in 2022 was among the widest seen in 20 years. Broad dispersion was exhibited across sector, style and market cap segments. The calendar year outperformance of large (S&P/ASX 50) versus small- and mid-cap companies (S&P/ASX Small Ordinaries and S&P/ASX MidCap 50) was 20.28% and 8.14%, respectively. This is the second-largest outperformance of large versus small and mid-caps over the past 20 years.
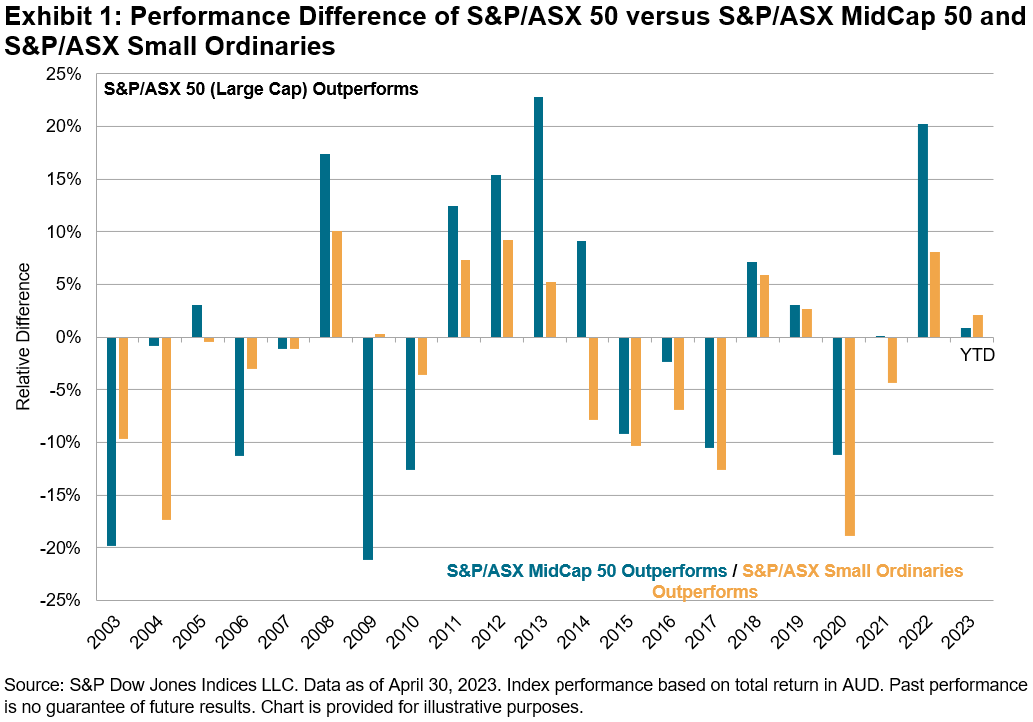
Mid- and Small-Cap Indices Offer Sector Diversification
Financials make up over 30% of the S&P/ASX 50 and 5 of its top 10 companies by index weight. The big four banks (CBA, NAB, ANZ and WBC) have benefited from rising interest rates and investor preference for dividend income in an inflationary environment. Different segments and sectors may out- or underperform during the various stages of an economic cycle. As inflationary pressures abate and interest rates seemingly level out, mid- and small-cap indices may offer diversification benefits away from the banks.
Presently, the S&P/ASX Small Ordinaries has more exposure to Consumer Discretionary and Real Estate companies, while the S&P/ASX MidCap 50 has more weight in Industrials and Information Technology companies relative to the small- and large-cap indices.

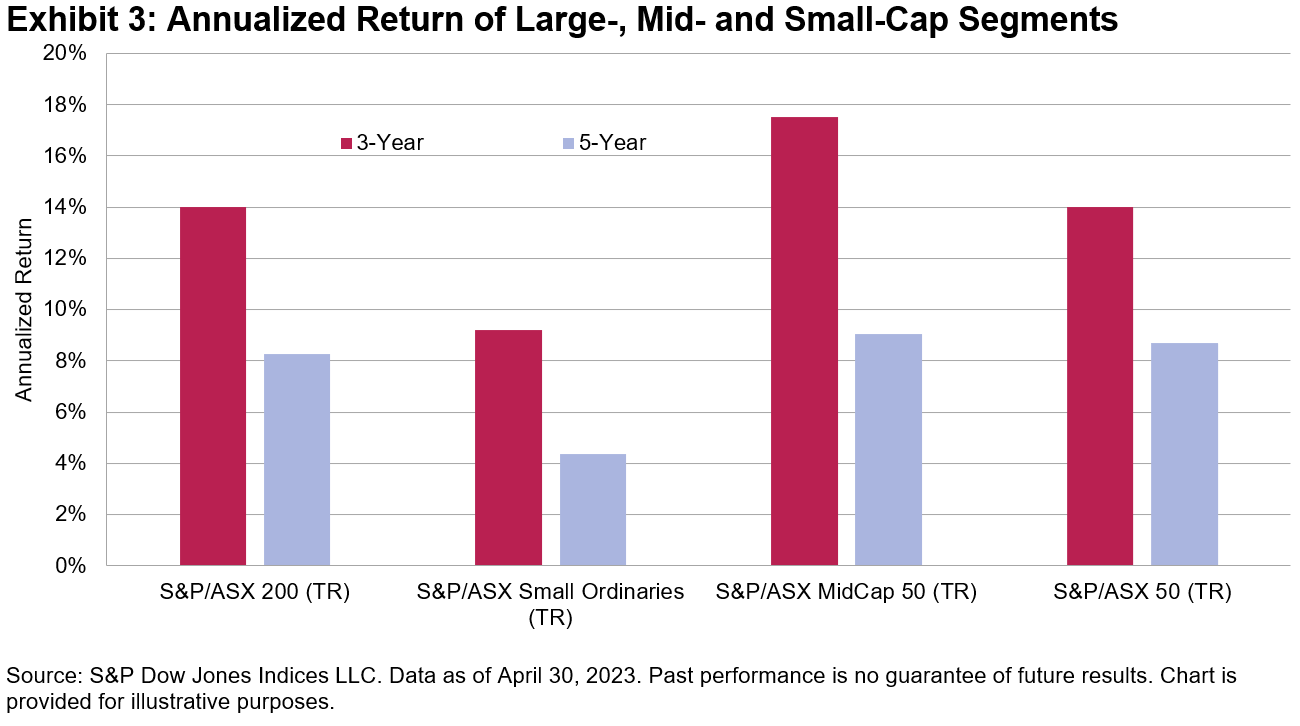
Small Caps Offer Most Compelling Relative Valuations
The different composition of the market cap segment indices has resulted in distinctive performance outcomes. As of April 30, 2023, mid-caps were the best-performing market segment over the three- and five-year periods. The S&P/ASX Small Ordinaries has underperformed during this period, however, it does exhibit the most compelling relative valuations.
The trailing 12-month price/earnings ratio for the S&P/ASX Small Ordinaries and S&P/ASX Mid Cap 50 are well below their long-term average, at approximately 9x and 14x earnings, respectively. Meanwhile, the three-year average of the 12-month trailing P/E ratio for the S&P/ASX Small Ordinaries recently moved lower than the S&P/ASX 50 for the first time in over 10 years.

Mid- and Small-Cap Active Managers Underperformed in 2022
Advocates of active management often argue there is more alpha to be found in the mid- and small-cap space. Furthermore, the broad dispersion of returns exhibited in 2022 is said to provide more of an opportunity set for skilled stock picking. However, S&P DJI’s SPIVA® Australia Year-End 2022 Scorecard shows just 23.4% of Australian Equity Mid- and Small-Cap active funds beat the S&P/ASX Mid-Small in 2022, while over 80% underperformed on a risk-adjusted basis. Funds in this category lost 19.8% and 22.0% on equal- and asset-weighted bases, respectively, for the same period.
The posts on this blog are opinions, not advice. Please read our Disclaimers.The Best of Both Worlds: Sustainability in Sectors

Sector-based approaches have historically shown they can be valuable for diversification, among other investor goals, but, until now, sustainability-inclined investors have been presented with limited options. With the recent creation of the S&P ESG Enhanced Sector Indices and the subsequent licensing of the Information Technology, Energy, Financials, and Health Care indices for a select range of ETFs in Europe, the potential for sector-based approaches to sustainable investing has increased significantly.
In assessing such potential, two questions are natural: first, what difference is there in sustainability profile for the ESG enhanced sectors? Second, what difference is there in performance—particularly in the context of a multi-sector allocation? Intuition tells us what to expect: while performance differentials at the individual sector level might be expected to be diminished by diversification effects, we should expect sustainability improvements to be preserved.
Focusing attention on the individual sector indices, Exhibits 1 and 2 summarize their sustainability and performance characteristics as compared to their benchmark sectors, using the same analytical engine driving S&P DJI’s Climate & ESG Index Dashboard.


The four S&P ESG Enhanced Sector Indices achieved significant ESG score and weighted average carbon intensity (WACI) improvements against their benchmarks, while maintaining tracking error ranges from 1.7% to 3.6%, for the Financials and Energy sector variants, respectively, and similar annualized returns across the full suite (see Exhibit 3). In addition to improvements in ESG score and WACI, these indices also achieve benchmark-relative enhancements in other climate metrics, such as carbon earnings at risk as a % of EBITDA as of March 31, 2023.
Exhibit 3 shows that even the limited tracking error reported in Exhibit 1 largely cancelled out over a longer (back-tested) performance horizon, for the whole range of S&P ESG Enhanced Sector Indices. Over the 10 years ending March 2023, the differentials in annualized total returns ranged from -0.1% to 1.8% across all 11 ESG enhanced sectors, with an annualized average absolute difference of just 0.5%.

But what about a hypothetical multi-sector allocation? To offer an illustration, a common approach is to harness the different risk and performance characteristics of sectors to navigate the market’s cycles. Sectors considered “defensive” are typically preferred in falling markets, while “procyclical” sectors are often preferred in rising markets. To evaluate the compatibility of ESG enhanced sectors with such approaches, we constructed four hypothetical portfolios, with and without the substitution of selected ESG variants (see Exhibit 4).

Results for the four blends over a decade suggest that the substitution of ESG enhanced sectors did not substantially alter the performance profile of the defensive and procyclical blends, as shown by similar outcomes for combinations with and without the S&P ESG Enhanced Sector Indices (see Exhibit 5, based on 10-year returns as of March 2023).

Bucketing periodic excess returns by months when the S&P Developed Ex-Korea LargeMidCap was rising (up markets) or falling (down markets) further illustrates the compatibility of ESG enhanced sectors with traditional defensive and procyclical approaches (see Exhibit 6). In a hypothetical blended portfolio, these behaved collectively even more like traditional sector indices, with a tracking error of only 2.1% for the Procyclical Blend with ESG and 2.2% for the Defensive Blend with ESG. These figures are lower compared to tracking error in ranges from 1.7% to 3.6% when ESG enhanced sectors are considered in isolation.

Overall, these exhibits showcase that building sustainability elements into sector indices may not necessarily come at the cost of desired benchmark-like characteristics. These indices offer the best of both worlds: an enhanced sustainability profile with performance characteristics closely aligned with traditional sector-based index strategies, making them a potentially valuable tool in the investor kit. Key performance and sustainability metrics for these indices can be monitored in S&P DJI’s Quarterly Climate & ESG Index Dashboard.
The author would like to thank Joseph Nelesen for his contributions.
GLOSSARY
WACI: Weighted Average Carbon Intensity. The index weighted average of individual company intensities (Scope 1, Scope 2, Scope 3 upstream and downstream emissions, normalized with enterprise value including cash).
FFR: Fossil Fuel Reserves. The carbon footprint that could be generated if the proven and probable fossil fuel reserves owned by index constituents were burned per USD 1 million invested.
Financial Impact of Physical Climate Risk: Financial losses (e.g., CapEx, OpEx, Business Interruption) reflected as a percentage of asset value due to exposure to climate-related physical hazards across scenarios and time periods. High Risk Scenario and 2050 time period are used for this Exhibit. For more information, please visit here.
Carbon Earnings at Risk as a % of EBITDA: This dataset helps to understand and assess the potential impact to a company’s earnings today if the company has to pay a future price for their greenhouse gas emissions. For more information, please visit here.
WAECI: Weighted Average Environmental Cost Intensity. This dataset helps to assess the index weighted average of environmental costs across key dimensions such as carbon emissions, land, water, air pollutants, and waste disposal, natural resource and water use. For more information, please visit here.
Board Female Representation (%): The index weighted average of the number of women on a company’s board of directors/supervisory board divided by the total number of board directors. For more information, please visit here.
1 Backward Data Assumption Date: https://www.spglobal.com/spdji/en/education/article/faq-esg-back-testing-backward-data-assumption-overview/
The posts on this blog are opinions, not advice. Please read our Disclaimers.Lessons from 20 Years of Equal Weight
How has equal-weight compared with cap-weight historically? S&P DJI’s Hamish Preston and Invesco’s Nick Kalivas explore how differences in index construction have influenced index performance, sector and factor composition, and results in the latest SPIVA Scorecards.
The posts on this blog are opinions, not advice. Please read our Disclaimers.The S&P GSCI Cooled in April as Inflation Cooled

- Categories Commodities
- Tags agriculture, commodities, copper, energy, gold, grains, industrial metals, inflation, S&P GSCI, S&P GSCI Agriculture, S&P GSCI Climate Aware, S&P GSCI Copper, S&P GSCI Grains, S&P GSCI Industrial Metals, S&P GSCI Softs, S&P GSCI Sugar, S&P GSCI Zinc, soft commodities, sugar, Zinc
The S&P GSCI fell 0.8% in April as the Fed’s preferred measure of inflation, Personal Consumption Expenditures (PCE), fell slightly on a year-over-year basis to 4.6%. Continued elevated readings of inflation, albeit cooling, led to market expectations that the Fed would hike rates again in May to bring inflation back to its 2% target. Commodities are generally good inflation hedges because they tend to move with changes in inflation to the upside and, most recently, to the downside.
Within the broad S&P GSCI benchmark, several commodity sectors declined, with the S&P GSCI Industrial Metals falling the most, down 3.0%. The S&P GSCI Copper and the S&P GSCI Zinc dragged down performance, as China’s Politburo stated their economy is still in a recovery phase, which will require continued fiscal and monetary support due to insufficient domestic demand. Expectations for China’s industrial sector to pick up on the demand side have not come to fruition yet, and recent issues with trade relations between Australia and China have not helped the industrial metals space.
The S&P GSCI Agriculture was the second-worst-performing sector, down 2.9% in April, with the S&P GSCI Grains the lowest performer, down 6.9%. Corn, soy and wheat were all dragged lower owing to strong crop progress and waning demand, as the U.S. Department of Agriculture said private exporters recently canceled several hundred thousand tons of corn. Brazil has a massive corn crop this year, and their less expensive crop has weighed on U.S. grain prices. The S&P GSCI Softs rose 12.3%, powered by the S&P GSCI Sugar, which rose 22.1% to a new 10-year high.
Competing forces were at play for the S&P GSCI Energy, leading to flat performance for the month. This sector constitutes more than half of the weight in the headline S&P GSCI and tends to have the highest inflation beta (or sensitivity to changes in inflation) of all commodities. Our recently launched S&P GSCI Climate Aware is the first-to-market commodities benchmark incorporating environmental considerations, and currently has a third of its weight toward energy commodities.
The S&P GSCI Gold flirted with a new all-time high as the U.S. dollar moved lower and uncertainty across markets led to a safe-haven bid.
The posts on this blog are opinions, not advice. Please read our Disclaimers.