


How does indexing work for large-cap equities? S&P DJI’s Hamish Preston and State Street Global Advisor’s Michael Arone take a closer look at lessons from 20 years of SPIVA, including fee savings, outperformance, and what the latest GICS® changes mean for sectors and industries moving forward.
The posts on this blog are opinions, not advice. Please read our Disclaimers.Examining Passive Performance at the Core
Diversification and Performance: Potential Applications of U.S. Equities in Japan
The “Devil’s Metal” Vanishes, Precious Metals Shine and Energy Dims: Commodities Quarterly Wrap
Minor Impact to Headline S&P/ASX Indices from GICS Changes
Exploring the Path to Net Zero in China’s Greater Bay Area
Examining Passive Performance at the Core
Diversification and Performance: Potential Applications of U.S. Equities in Japan

The U.S. equity market is by far the largest in the world, representing 57.7% of the global market capitalization, and it is nearly nine times the size of the Japanese equity market (see Exhibit 1). Hence, Japanese investors may wish to consider U.S. equities in order to not overlook a significant portion of the global opportunity set.
The S&P 1500™ is designed to measure the performance of the U.S. equity market and its construction helps it avoid less liquid, low priced and lower quality stocks. The index combines the S&P 500®, S&P MidCap 400® and S&P SmallCap 600® and captures over 90% of the U.S. equity market capitalization. Although smaller U.S. equity segments may seem less relevant to international investors, the breadth and depth of the U.S. equity market means that mid- and small-cap U.S. equities represent a significant portion of the global market and are larger than some regional markets.

The U.S. equity market has distinct sector exposures, so one potential benefit of incorporating U.S. equities is that they can help to alleviate domestic sector biases. For example, Exhibit 2 shows the GICS® sector weights of the Japanese equity market—as represented by the S&P Japan 500—and its relative sector weights versus the S&P 1500. Adding U.S. equities can help redistribute sector weights toward the I.T., Health Care and Energy sectors, while also decreasing the concentration to Industrials, Consumer Discretionary and other sectors.

The historical performance of U.S. equities may offer another potential reason for Japanese investors to consider U.S. equities. Exhibit 3 shows that the U.S. equity indices have outperformed the Japanese equity indices since 1994. The S&P 1500 slightly outperformed the S&P 500 due to its exposure to mid and small caps.

Exhibit 4 depicts the long-term risk/return tradeoff for several hypothetical portfolios combining the S&P Japan 500 and S&P 1500 in JPY. The chart shows that increasing allocation to the S&P 1500 provided better performance than purely local strategies, historically.

From its representation of a significant portion of the global opportunity set, to potential sector diversification benefits and historical performance improvements, U.S. equities may be worth consideration for Japanese market participants.
The posts on this blog are opinions, not advice. Please read our Disclaimers.The “Devil’s Metal” Vanishes, Precious Metals Shine and Energy Dims: Commodities Quarterly Wrap

“Jamie ran on down to the LME, but the devil caught him there,
He took Mr. Dimon’s Nickel bags and vanished in the air,
Set out running but I’ll take my time,
A friend of the devil is a friend of mine”
-adaptation of Grateful Dead’s “Friend of the Devil”
Just one year after the London Metal Exchange (LME) nickel market broke down, the “devil’s metal” found itself back in the headlines. This time around, the LME reported that 54 metric tons, worth about USD 1.3 million, of nickel turned out to be bags of stones.1 J. P. Morgan was revealed to be the registered owner tied to contracts slated for physical delivery, and the S&P GSCI Nickel registered a 20.54% decline for Q1 2023. Nickel represents more than a third of the S&P GSCI Electric Vehicle Metals Index and the component’s performance has dragged the overall index into bear market territory, with a one-year return of -24.73%.
Commodity-based inflation readings (including food and energy) experienced record drops in the eurozone. That didn’t stop silver and gold from rebounding nicely on the month, as the non-commodity inflation indicators, or core measures, continued to give credence to central banks focused on bringing price increases down to a simmer. The S&P GSCI Silver and S&P GSCI Gold rallied total returns of 15.11% and 7.61%, respectively.
Widening out to the broad commodities market, the world’s leading commodities benchmark, the S&P GSCI, lagged stock and bond indices, falling 1.07%. Meanwhile, the S&P GSCI Energy fell 3.49% for the month, and oil futures continued to show discounts out the forward curve, supporting expectations that supply constraints will abate. Output of nearly half a million barrels of oil, or 5% of global production per day, was cut by a court ruling in favor of the Iraqi government. Iraq successfully argued that Turkey violated prior agreements by importing oil from the Kurdistan Regional Government.
The worst-performing segment of the S&P GSCI was natural gas, dropping 23.22% to its lowest level since January 1994. Following a mild winter and expected seasonal demand declines in spring, natural gas storage levels have come down. U.S. capacity to convert to liquified natural gas (LNG) picked up with the resumption of shipments from the Freeport LNG export plant in February. Four more LNG plants were expected to be built to meet European demand. However, increased borrowing costs and lower gas prices were cited as reasons for halting two of those plants.
Within agriculture, the S&P GSCI Sugar rallied 11.32% in March, hitting a five-year high as India cut exports after rain damage to their sugar crop. The S&P GSCI Sugar has been the “sweetest” or best-performing constituent of the 24 commodities comprising the headline S&P GSCI in 2023, up 20.27% YTD and 27.63% year-over-year.
1 Home, Andy. “The return of the London Metal Exchange’s nickel curse.” Reuters. March 21, 2023.
The posts on this blog are opinions, not advice. Please read our Disclaimers.Minor Impact to Headline S&P/ASX Indices from GICS Changes

Revisions to the Global Industry Classification Standard (GICS®) structure were implemented at the March S&P/ASX rebalance. The changes affect the GICS structure at all levels and involve a number of intra- and inter-sector changes for companies within the S&P/ASX 200 and S&P/ASX 300.
Inter-sector changes are the reclassification of constituents to a different sector under the new GICS structure, while intra-sector changes refer to firms being reclassified (i.e., sub-industry updates) within their current sector.
Inter-Sector Changes
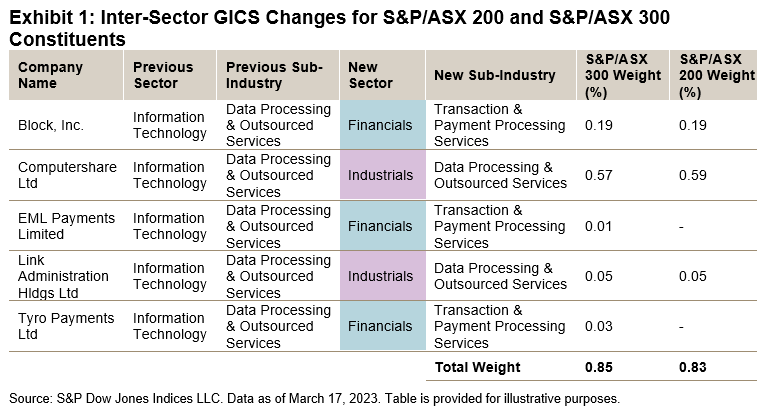
All of the companies within the S&P/ASX 200 and S&P/ASX 300 that will change sector are part of the discontinued Data Processing & Outsourced Services sub-industry within the Information Technology sector. Companies within this sub-industry will either be reclassified to the new Transaction & Payment Processing Services sub-industry within the Financials sector or moved to the Industrials sector under the new Data Processing & Outsourced Services sub-industry.
This change has resulted in five companies within the S&P/ASX 300 changing sector, with three of those companies being constituents of the S&P/ASX 200. Collectively, these companies make up less than 0.90% of weight in each index.
Intra-Sector Changes
GICS changes that were implemented in the Consumer Discretionary sector redefined sub-industries based on the nature of goods sold. The discontinuation of the Internet & Direct Marketing Retail Subindustry, as well as the merger of General Merchandise Stores and Department Stores into a new sub-industry called Broadline Retail, account for several reclassifications.
The Real Estate sector was affected by an increased granularity of company classifications within real estate investment trusts (REITs). In particular, self-storage, data centers, telecom towers and timber REITs were given their own categories, while further granularity was also added to residential REITs.
Meanwhile in the Financials sector, the Thrifts & Mortgage Finance sub-industry (within the Banks industry group) has been discontinued. Mortgage finance companies mainly offer mortgage finance-related products & services and generates fee-based revenue, distinct from banks. These companies will move into the Financial Services industry group as a new sub-industry—Commercial & Residential Mortgage Finance.
Another change worth noting is that the Trucking sub-industry within Transportation was discontinued, with new sub-industries Ground Transportation and Passenger Ground Transportation being created.
In total, there are 13 companies within the S&P/ASX 300 and seven within the S&P/ASX 200 that were reclassified into a different sub-industry, amounting to a collective index weight of 3.22% and 3.16%, respectively.

Exploring the Path to Net Zero in China’s Greater Bay Area
How can indices help inform investors charting a course for net zero? Priscilla Luk of S&P DJI joins Dr. Qu Kang of Bank of China Hong Kong to discuss the potential role of index-based innovations in regional carbon reduction initiatives and what these developments could mean for the potential opportunity set.
The posts on this blog are opinions, not advice. Please read our Disclaimers.