Get Indexology® Blog updates via email.

In This List

Refining the Quality Metrics

Why Are U.S. Equities and the Real Estate Sector Relevant to the Chilean Market?

Size, Sectors and Skew: Observations from the SPIVA MENA Mid-Year 2022 Scorecard

Islamic Benchmarks Continued to Fall in Q3, in Line with Conventional Indices

Despite a Bumpy Start to 2022, Latin America Outperforms Most Global Markets in Q3 and YTD

Refining the Quality Metrics

Contributor Image
Wenli Bill Hao

Director, Factors and Dividends Indices, Product Management and Development

S&P Dow Jones Indices

Introduction

High-quality companies have always been appealing to investors. In fact, quality equity investing was documented as early as 1949 by Benjamin Graham in his original publication of The Intelligent Investor.1

Despite a wide range of definitions for what constitutes a high-quality company, characteristics such as profitability, competitive position, earnings quality, corporate governance and modest debt levels seem to be common markers agreed upon by the investment community.

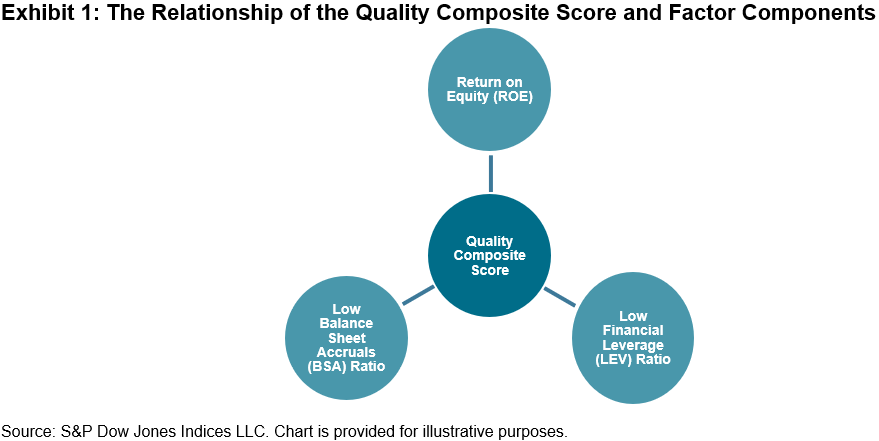
Currently, S&P Dow Jones Indices (S&P DJI) measures quality as a composite score of high profitability (ROE), low balance sheet accruals (BSA) and low financial leverage (LEV) (see Exhibit 1). A company’s overall quality score is the average of the z-scores of these three components.2

Refinement

To better align the computation of the quality factors with both industry and academic research practices, S&P DJI is implementing the following four changes after consulting with market participants.

  1. If the underlying earnings per share (EPS) or book value per share (BVPS) for a given stock’s ROE is negative, its ROE value will not be calculated, and the stock’s ROE z-score will be set equal to the lowest ROE z-score in the universe.
  2. If the underlying EPS or BVPS for a given stock’s ROE is negative, the quality score will be calculated, but it will be ineligible for index inclusion for the highest quintile (or equivalent) quality indices. For the S&P Quality, Value & Momentum Top 90% Multi-Factor Indices and S&P Quality – Lowest Quintile Indices, if the underlying EPS or BVPS for a given stock’s ROE is negative, the stock’s quality score will be calculated, and it will be eligible for index inclusion.
  3. The denominator of the accruals ratio calculation will use the average total assets rather than the average net operating assets.3
  4. For stocks classified in the Financials (GICS 40) or Real Estate (GICS 60) sectors, the accruals ratio calculation will not be applied. The ROE and LEV ratios will only be used to calculate a stock’s quality score.3

Rationale for Changes

The first change penalizes negative EPS or BVPS stocks by assigning them the lowest ROE z-scores in the universe, while the second change ensures that all constituents of the highest quality quintile have positive EPS and positive BVPS. Such requirements set higher standards for a stock to be included in the quality indices. The third change reduces the accruals ratio volatility and avoids negative values in the denominator. Lastly, the fourth change addresses the issue that the accruals ratio is not applicable to the Financials and Real Estate sectors. Importantly, these changes further align our factor metrics with industry and academic norms.

Potential Impacts of Changes

To help evaluate the potential impacts of the proposed changes, we built three hypothetical indices (Proposed S&P 500® Quality Index, Proposed S&P MidCap 400® Quality Index and Proposed S&P SmallCap 600® Quality Index), which incorporate the changes specified. We then compared the constituents of the current S&P 500 Quality Index, S&P 400® Quality Index and S&P 600® Quality Index with those of the corresponding proposed indices. The impacts are evaluated from the following aspects.

Names, Weights and Turnovers

The current quality indices and the corresponding proposed indices select the top 20% of stocks from the underlying universes (S&P 500, S&P 400 and S&P 600), resulting in 100, 80 and 120 constituents, respectively. The overlapping names were all above 71%, while the overlapping weights are all above 74% (see Exhibit 2).

Starting from the pre-rebalance of constituents in June 2022, the Proposed S&P 500 Quality Index had a slightly lower turnover than the current S&P 500 Quality Index. Conversely, the proposed S&P 400 and 600 Quality Indices had slightly higher turnovers than the current S&P 400 and 600 Quality Indices.

Sector Comparison

Exhibit 3 shows that the Proposed S&P Quality Indices had higher weights in the Information Technology, Consumer Discretionary, Industrials and Health Care sectors, while having a significantly lower weight in the Financials sector versus the current S&P Quality Indices.

Implementation

The proposed changes will be implemented during the regular index rebalance, starting with the September 2022 rebalancing period.

Importantly, the S&P Quality Indices Methodology, S&P Quality, Value & Momentum Multi-factor Indices Methodology, S&P Factor-Based Quintile Indices Methodology and other impacted methodologies will be updated to reflect these changes.


1 Ung, D., Luk, P. and Kang, X. “Quality: A Distinct Equity Factor?”, S&P Dow Jones Indices, 2014.

2 For further information about the factor definition, factor score calculation and index design, please see the S&P Quality Indices Methodology.

3 Sloan, R. Do Stock Prices Fully Reflect Information in Accruals and Cash Flows about Future Earnings? The Accounting Review, Vol. 71, No. 3. (July 1996), pp. 289-315.

The posts on this blog are opinions, not advice. Please read our Disclaimers.

Why Are U.S. Equities and the Real Estate Sector Relevant to the Chilean Market?

Contributor Image
Cristopher Anguiano

Senior Analyst, U.S. Equity Indices

S&P Dow Jones Indices

U.S. Equities’ Predominance

U.S. equities represent 59.1% of the total global equity market in terms of float market capitalization (FMC) and at least 50% of the weight in 8 of the 11 GICS sectors globally. Given trends and narratives, U.S. equities seem to have an outsized role in explaining performance globally and may help investors to understand market dynamics.

Real Estate Sector Evolution

U.S.-domiciled companies accounted for 60% of the global Real Estate sector’s float-market capitalization as of Sept. 30, 2022, and Real Estate companies within the U.S. market have increased in number and size over the past decade. For example, Exhibit 2 shows there were 113 Real Estate companies in the S&P Composite 1500® at the end of September 2022, with a collective FMC of USD 1,060 billion, up from 35 companies with USD 142 billion of FMC at the end of 2005.

Long-Term Risk/Return Characteristics

The S&P IPSA, the Chilean large-cap benchmark, has shown strong returns YTD. But over the long term, the U.S. Real Estate Select Sector and the S&P 500® outperformed with lower return volatility.

Combined with the relatively low average five-year rolling correlation (0.33) between the Real Estate Select Sector and the S&P IPSA, historically, Chilean market participants may wish to consider the potential diversification of incorporating U.S. Real Estate and U.S. equities more broadly.

The Real Estate Select Sector has grown in recent years and has offered higher dividend yield than the S&P 500 and many of its GICS sector segments. Hence, this sector and the U.S. equities market may be of interest to Chilean investors, especially in the current inflationary environment.


The posts on this blog are opinions, not advice. Please read our Disclaimers.

Size, Sectors and Skew: Observations from the SPIVA MENA Mid-Year 2022 Scorecard

Contributor Image
Anu Ganti

U.S. Head of Index Investment Strategy

S&P Dow Jones Indices

The semiannual S&P Indices Versus Active (SPIVA®) Scorecards1 measure the performance of actively managed funds against their corresponding benchmarks in various markets around the world. According to the latest SPIVA MENA Mid-Year 2022 Scorecard, the majority of MENA active equity managers outperformed their benchmarks, despite a turbulent second quarter and geopolitical tensions.

Performance across the cap spectrum was mixed, as we observe in Exhibit 1, which divides the S&P Pan Arab Composite constituents into quartiles by their index weight and calculates the weighted average constituent return for each. Quartiles 1 and 4, the smallest and largest quartile, comprised the worst performers, while Quartiles 2 and 3 outperformed. As a result, active managers who targeted the mid-sized quartiles might have had a better probability of outperformance. The underperformance of the largest names perhaps boded well for active managers, whose portfolios have tended to be closer to equal weighted than cap weighted.2

But simply targeting the mid-sized quartiles may not have been sufficient. For example, Emirates Telecommunications Group Company PJSC was the worst contributor to the S&P Pan Arab Composite’s performance and happened to be in one of the mid-sized quartiles. A rise in stock-level dispersion or cross-sectional volatility created opportunities to add value from stock selection.3 Further, the spread among sectoral performances trended higher over the past year (see Exhibit 2), which could have made sector allocation more valuable. Not coincidentally, avoiding Communication Services and gaining exposure to Financials was important for success. Within Financials, exposure to Alinma Bank and avoidance of Al Rajhi Bank was rewarded.

As a result of these tailwinds, the average fund return outperformed the benchmark return across all fund categories. To put these results in context, we compare the average fund excess return (relative to the benchmark) versus the median fund excess return.

Exhibit 3 illustrates that fund performance was characterized by negative skewness. The dashed grey diagonal identifies an equal median and average return. Across categories, results were above and to the left of the diagonal line, meaning that the average excess return was lower than the median excess return. We can interpret this to mean that, while more than one-half of active managers outperformed, there were more big losers than big winners.

Although the first half of 2022 was characterized by higher volatility in the MENA region, fortuitous factors, including the underperformance of mega caps along with higher stock and sector dispersion, aided the outperformance of active managers. For more insights on MENA, you can access the latest report here.

1 For more information, see SPIVA Scorecards: An Overview. https://www.spglobal.com/spdji/en/education/article/spiva-scorecards-an-overview

2 Ganti, Anu, “Mutual Fund Portfolio: Equal Weight or Cap Weight?” Indexology® Blog, July 2017, https://www.indexologyblog.com/2017/07/27/mutual-fund-portfolios-equal-weight-or-cap-weight/.

3 Ganti, Anu, “Opportunity to Outperform,” Indexology Blog, June 2022, https://www.indexologyblog.com/2022/06/09/opportunity-to-outperform/.


The posts on this blog are opinions, not advice. Please read our Disclaimers.

Islamic Benchmarks Continued to Fall in Q3, in Line with Conventional Indices

Contributor Image
Eduardo Olazabal

Associate Director, Global Exchange Indices

S&P Dow Jones Indices

Global equities dropped 6.6% in Q3 2022, as measured by the S&P Global BMI, accumulating a loss of 25.6% YTD. Meanwhile, Shariah compliant benchmarks, including the S&P Global BMI Shariah and Dow Jones Islamic Market (DJIM) World Index, managed to outperform their conventional counterparts by 0.6%.

Overall, regional broad-based Shariah and conventional equity benchmarks accumulated further losses this quarter, as interest rates continued to rise, leading to the strengthening of the U.S. dollar and further impacts on non-U.S. equities. The Pan Arab region remained unaffected, as the Shariah benchmark finished the quarter with marginal gains.

Drivers of Shariah Index Performance in Q3 2022

While this year’s broad negative trend continued through Q3, sector compositions can provide some explanation for this quarter’s results. Higher exposure to growth-oriented Information Technology stocks within Islamic indices contributed most to the negative performance, as growth-oriented IT shares sank 6.9% in Q3.

Health Care and Communication Services also had a significant negative impact on the S&P Global BMI Shariah, dropping 6.4% and 13.4% during the quarter, respectively.

Energy continued to be an outlier sector, as it was the sole sector to manage gains during the period. However, due to its low weight of 3.6% in Islamic indices, the impact was minimal.

Mixed Results in MENA Equities

MENA regional equities experienced mixed results in Q3. The regional S&P Pan Arab Composite increased marginally by 0.5% in Q3, accumulating a minor loss of 0.5% YTD. GCC country performance was generally positive, with significant gains in Oman (up 9.3%) and Bahrain (up 6.8%) and major losses in Kuwait (down 6.7%). The case of Oman is notable, as it is one of the world’s best-performing country indices, with a YTD gain of 21.3%.

For more information on how Shariah-compliant benchmarks performed in Q3 2022, read our latest Shariah Scorecard.

This article was first published in IFN Volume 19 Issue 41 dated Oct. 12, 2022.


The posts on this blog are opinions, not advice. Please read our Disclaimers.

Despite a Bumpy Start to 2022, Latin America Outperforms Most Global Markets in Q3 and YTD

Contributor Image
Silvia Kitchener

Director, Global Equity Indices, Latin America

S&P Dow Jones Indices

What a year it is turning out to be for Latin American equities. Despite the turbulence of the past three quarters, Latin America has been resilient. As shown in Exhibit 1, the S&P 500® and S&P Emerging BMI have declined in every quarter of 2022 and have lost more than 20% each YTD as of Sept. 30, 2022. Meanwhile, the S&P Latin America BMI gained 3.6% in Q3, edging into positive territory YTD.

While returns have been mixed across countries and quarters, it’s clear that Chile and Brazil’s stellar performance contributed to Latin America’s overall gains. Moreover, among global country indices Chile and Brazil ranked among the top five best performers for Q3 and YTD.1

The story in the region has not changed much since last quarter, with inflation, rising interest rates, the Russia-Ukraine conflict and domestic political uncertainty continuing to loom over the region. Despite these headwinds, markets in general have done relatively well in Q3. Except for Colombia and Mexico, all other equity markets gained during the quarter, with Argentina’s S&P MERVAL posting the largest gains of 57% in ARS. Chile’s S&P IPSA ended the quarter up 3% in CLP, and it was the only index with positive returns for every quarter of 2022. The S&P Brazil BMI’s strong returns of nearly 12% offset Mexico’s S&P/BMV IRT loss of 6%.

In terms of sectors, most ended on a positive note, with top performers Information Technology, Consumer Discretionary and Energy posting gains of 27.5%, 18.6% and 16.6%, respectively. The Financials sector, which gained 8.3%, and the Energy sector, up 16.6%, were the largest contributors to the overall returns for the region. Materials (-6.0%), the second-largest sector in the region after Financials, had the largest negative impact on the region’s returns for the quarter.

The top 10 largest companies by index weight, representing over 30% of the index, had a significant impact on performance in Q3. Specifically, Brazilian giants Petrobras and Itau Unibanco were major drivers in leading the region to positive territory. Mining companies like Brazil’s Vale, Mexico’s Grupo Mexico and Peru’s Southern Copper were significantly affected by the drop in metal prices for iron ore and copper, which were down 18.3% and 22.0% YTD, respectively.2 Communication Services ended the quarter at the far end of the negative side, driven by Mexico’s America Movil’s price drop of nearly 13% for Q3.

Despite the ups and downs of the markets, Latin American equities have remained resilient so far. As we enter Q4, it will be interesting to see if the region can hang on to these gains and hopefully add some more as the year comes to an end.

For more information on how Latin American benchmarks performed in Q3 2022, read the latest Latin America Scorecard.


1 S&P Global Equity Indices Monthly Update. Sept. 30, 2022. sp-global-equity-indices-monthly-update.pdf

2 Source: S&P Capital IQ Pro. Data as of Sept. 30, 2022. Iron Ore 62% FE (CME-NYMEX). Copper (COMEX).

The posts on this blog are opinions, not advice. Please read our Disclaimers.