Get Indexology® Blog updates via email.

In This List

Commodities for Breakfast

Bringing Transparency to Green Bonds

A Reliable Strategy in Unreliable Times

Hedging Inflation with the S&P/BMV IPC

Emerging Market-Listed Companies Enter the S&P Global Clean Energy Index

Commodities for Breakfast

Contributor Image
Jim Wiederhold

Former Director, Commodities and Real Assets

S&P Dow Jones Indices

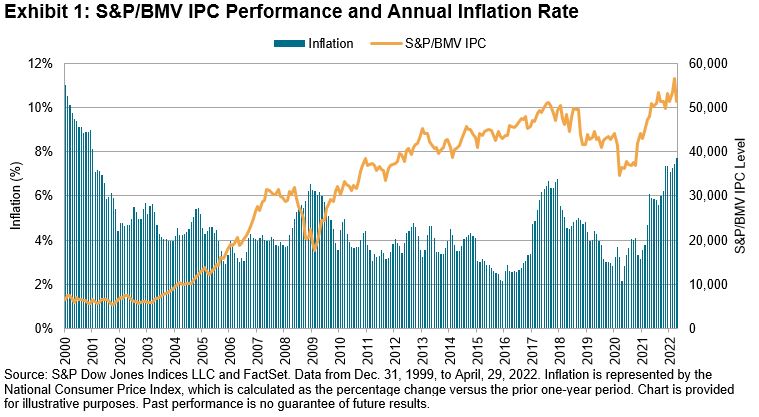
Except for intermittent fasting groups or keto dieters who tend to skip it, breakfast is considered by many to be the most important meal of the day. Now, there is a reliable and publicly available benchmark for the performance of the most liquid commodities typically consumed at breakfast. The S&P GSCI Dynamic Roll Breakfast (OJ 5% Capped) is a global production-weighted index offering another example of thematic ways to look at commodities allocations within portfolios. A liquidity-based allocation to orange juice (OJ) has been incorporated into the index construction, because breakfast without OJ is like a day without sunshine. With a three-year annualized total return of 20.15%, the performance has outpaced broad equities, other asset classes and even the market standard commodities benchmark, the S&P GSCI, by 5% annualized. If breakfast commodities were its own commodities sector, it would have been the second best performing over the past three years (see Exhibit 1).

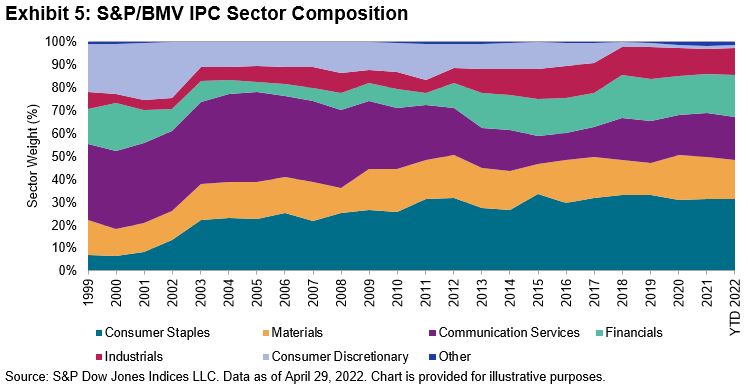
The heavy agriculture weighting of the index, at roughly 90%, is the clear main driver of performance for breakfast. Not forgetting bacon, lean hogs currently have a weight of about 10% to round out the theme. Corn and wheat make up the bulk of the index, because these two breakfast commodities are by far the most produced and consumed commodities around the world; roughly two billion tons of corn and wheat are produced each year in total. The other commodities are much smaller, and this is reflected in the current percentage weights as of the end of April (see Exhibit 2).

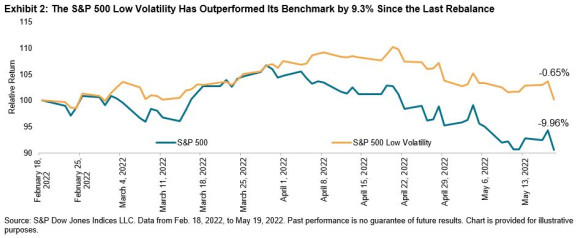
A growing concern among central bankers regarding food inflation serves to highlight the importance of agricultural commodities to the global economy from both a societal and environmental perspective. This new index may offer a way of gaining exposure to themes such as inflation and geopolitics. The Ukraine-Russia conflict is disrupting global food and energy supplies to an unprecedented degree. A prime example is the tightening global wheat supply picture. Ukraine is considered Europe’s breadbasket and roughly one-third of global exports of wheat comes from the Ukraine/Russia region. Wheat exports out of the Black Sea have been strained over the past few months as the conflict continues. Global wheat prices have skyrocketed, and with the high weighting in the breakfast index, wheat was an important driver in the solid performance. In response to the geopolitical tensions and persistent supply chain bottlenecks, food protectionism is returning to the fore. For example, plans by India, the world’s largest exporter of sugar, to restrict exports to prevent a surge in domestic prices could put additional pressure on global sugar supplies.

Finally, the S&P GSCI Dynamic Roll Breakfast (OJ 5% Capped) employs a flexible monthly futures rolling strategy designed to alleviate the negative impact of rolling into contango and potentially limit volatility exposure to the commodities market. With its global focus, this new thematic index demonstrates our continued efforts to bring replicable and investable commodities-based benchmarks to a public audience.

The posts on this blog are opinions, not advice. Please read our Disclaimers.

Bringing Transparency to Green Bonds

As the global green bond market continues to grow, how are indices helping investors assess greenium and the potential opportunity set? S&P DJI’s Brian Luke joins VanEck’s Bill Sokol and Phil Kirouac for a closer look at how indexing works for green bonds.

https://youtu.be/TEomyDhdG0E


The posts on this blog are opinions, not advice. Please read our Disclaimers.

A Reliable Strategy in Unreliable Times

Contributor Image
Fei Mei Chan

Former Director, Core Product Management

S&P Dow Jones Indices

Try as one might, it is hard not to notice the woes of equities this year. Through May 19, 2022, the S&P 500® has declined 18%, losing 9% in the last three months alone. This pain was felt across most sectors of the index, with only Consumer Staples, Energy, and Utilities in positive territory for the year. Exhibit 1 shows that volatility increased in every sector except Energy in the last three months.

Despite the general increase in volatility, there were clearly pockets of stability in the market, as the S&P 500 Low Volatility Index is actually flat since its last rebalance on Feb 18, 2022, down 0.7%. Exhibit 2 contrasts the performance of low volatility index with that of the S&P 500, which declined 10.0% in the same period. The low volatility index is designed to mute the gyrations of the market in both directions (which it has historically done with reasonable reliability). It should go down less when the market is down, but also go up less when the market is up. And it has certainly done what it is designed to do in the current market rout.

Effective after the market close May 20, 2022, the S&P 500 Low Volatility Index will have almost half its weight in just two sectors, Utilities (26%) and Consumer Staples (22%). As shown in Exhibit 3, the latest rebalance saw a significant increase in Utilities, Financials and Real Estate, and reductions in exposure to the Consumer Discretionary, Health Care and Technology sectors. Despite its strong performance, Energy still has no presence in the index—not a surprise since it remains the most volatile sector of the S&P 500.

The posts on this blog are opinions, not advice. Please read our Disclaimers.

Hedging Inflation with the S&P/BMV IPC

Contributor Image
Eduardo Olazabal

Associate Director, Global Exchange Indices

S&P Dow Jones Indices

Inflation in Mexico has reached levels not seen in over 20 years, as the S&P/BMV IPC has receded from its all-time high reached earlier this year (see Exhibit 1). In this environment, market participants may question how inflation may affect index performance and the effectiveness of equity allocations as a hedge against it.

First, let’s analyze how the index has performed during periods of rising inflation. Exhibit 2 shows the rolling 12-month return of the S&P/BMV IPC compared with changes in inflation represented by the National Consumer Price Index (CPI) since 2000. For periods corresponding to rising inflation, the index returns were positive 75% of the time; however, during periods of sharp increases in inflation (over 3%), this figure increased to 100%, as shown by the returns in the circle. This shows that, historically, high inflation was associated with strong performance in the Mexican equity market.

How has the S&P/BMV IPC performed relative to inflation? Have allocations to the index served as a hedge against inflation, especially during periods of high inflation?

We can see in Exhibit 3 that, excluding periods of externally driven economic turmoil (the dot-com bubble, the Great Financial Crisis of 2008, the NAFTA renegotiation in the late 2010s and the COVID-19 pandemic), the market generally outperformed inflation by a significant amount. Since 2000, the index outperformed inflation in 60% of rolling 12-month periods. Including dividends being reinvested as measured by the S&P/BMV IRT, this grew to 68%. If we look at the past 10 years, the average outperformance was 9.4% on a price return basis and 10.4% including dividends. Analyzing the entire period in Exhibit 4, the S&P/BMV IPC provided a cumulative return of 127% over inflation and 168% with reinvested dividends, as represented by the S&P/BMV IRT.

Lastly, this strong performance during rising inflation can be explained in part by the index’s composition. Consumer Staples and Materials, two sectors commonly considered to perform relatively well in inflationarity environments,1 make up nearly 50% on average of the S&P/BMV IPC over the past 10 years (see Exhibit 5). Therefore, their contribution to the index’s total return can be significant during these periods.

In conclusion, the S&P/BMV IPC has generally performed well during periods of rising inflation, more so during sharp increases, and has provided signficant real returns above inflation over the long run.


1 Demand for Consumer Staples tend to be relatively inelastic, so these companies are typically able to pass along rising prices better than other sectors. Commodity-oriented sectors such as Materials also tend to perform well in inflationary environments, as these companies benefit from rising commodity prices.

The posts on this blog are opinions, not advice. Please read our Disclaimers.

Emerging Market-Listed Companies Enter the S&P Global Clean Energy Index

Contributor Image
Zachary Botzenhart

Former Associate Director, Strategy Indices

S&P Dow Jones Indices

In October 2021, the S&P Global Clean Energy Index implemented most of the items addressed in the August 2021 consultation, which improved transparency, reduced the index’s carbon footprint and better aligned the index methodology with market trends.1 The latest rebalance (effective April 25, 2022), was a continuation of that consultation, with a focus on diversification by adding companies listed in emerging markets.2

The Inclusion of Emerging Market Companies Has Created a ‘Cleaner’ Clean Energy Index

The expansion to include companies listed in emerging markets allows the index to track a larger selection universe. The index is now composed of 100 constituents (formerly 75), thus achieving the target count as outlined in the index methodology. Further, the index purity, as defined by the weighted average exposure score,3 has also improved (see Exhibit 1). The current target stock count is achieved by selecting companies that have either exposure scores of 1 or 0.75, with the majority of companies achieving a score of 1. Previously, the index also included companies with an exposure score of 0.5.

Exhibit 1 shows that close to 75% of the index weight is now composed of companies that have been assigned a maximum clean energy exposure score, a notable improvement compared to the previous composition. Additionally, we observe an improvement in the carbon intensity score.

Emerging Markets Companies Added at “Half” Weight

S&P Dow Jones Indices announced in February 2022 that companies listed in emerging markets will be incorporated in a two-phased approach coinciding with the reconstitutions in April and October 2022. Therefore, all emerging market-listed companies that were added at this April rebalance were added at one-half of their target weights, with the remaining half to be added at the October 2022 rebalance. Of the 33 companies added to the index, 29 were listings from emerging markets, making up 9% of the index weight. The weights of these companies are expected to double at the next rebalance in October 2022. Considering all changes for the April 2022 rebalance, the one-way turnover incurred was 24.5%.

China and Brazil Increased Their Presence in the S&P Global Clean Energy Index

The countries with the most additions were China (16) and Brazil (6), which increased their respective country weights to 11.7% and 3.9% within the index. Conversely, companies from Denmark and the U.K. were most affected in the opposite direction, with decreases of 3.35% and 4.14%, respectively (see Exhibit 2). Overall, emerging market companies have increased their overall weight in the index by 10%, representing close to 20% of the S&P Global Clean Energy Index. At full inclusion, after the October 2022 rebalance, we anticipate that this figure will rise above 25% (see Exhibit 3).

Emerging Markets Inclusion Has Improved the S&P Global Clean Energy Index

Our analysis in this blog highlights that the expansion has aligned the index even more with its intent to focus on companies that are related to clean energy. Additionally, the broader index delivers greater geographical diversification. The International Energy Agency5 has seen a 50% increase in clean energy spending since October, and it has noted that it expects this to increase. As the clean energy transition takes shape in emerging economies,6 we expect these developments to be fairly reflected within the S&P Global Clean Energy Index.


1 Rajendra, Ari. “S&P Global Clean Energy Index: A Path toward Greater Transparency.” S&P Dow Jones Indices. Oct. 20, 2021.

2 The S&P Global Clean Energy Index previously included emerging market companies that were listed on developed exchanges.

3 All companies in the S&P Global Clean Energy Index universe are assigned exposure scores that denote their involvement in clean energy-related businesses. An exposure score of 1 is assigned to companies with maximum clean energy exposure, 0.75 to companies with significant clean energy exposure, 0.5 to companies with moderate clean energy exposure, and 0 to companies with no exposure.

4 The carbon-to-revenue (carbon intensity) footprint standard score is calculated for each stock in the preliminary universe. The score is calculated by subtracting the mean carbon-to-revenue footprint of all preliminary universe stocks with an exposure score of 1 as of the rebalancing reference date from each stock’s carbon-to-revenue footprint, and then dividing the difference by the standard deviation (also determined based on preliminary universe stocks with an exposure score of 1). The top and bottom 5% are excluded from the mean and standard deviation calculations. Companies with a score greater than 3 will not be eligible for inclusion.

5 International Energy Agency. “Clean Energy Spending Has Surged 50%.” April 12, 2022.

6 International Energy Agency. “Clean Energy Transitions in Emerging Economies.”

The posts on this blog are opinions, not advice. Please read our Disclaimers.