Get Indexology® Blog updates via email.

In This List

Perspectives on the Current Crypto Slump

A Practical Look at Index Liquidity in Asia

S&P 500 Weekly Options Now Expire Five Days a Week

Transparency, Independence and Integrity as the Bedrocks of Indexing

Value Resurgent, Part 2

Perspectives on the Current Crypto Slump

Contributor Image
Sharon Liebowitz

Former Head of Innovation

S&P Dow Jones Indices

I’ll avoid the usual platitudes about the market downturn. Instead, I’d like to focus on how we can better understand the current cryptocurrency market movement by looking at the S&P Cryptocurrency Indices. First, to set the context for the current drawdown, we’ll take a look at the biggest declines in Bitcoin. Then, we’ll take a more detailed look at the performance of specific cryptocurrency market-cap segments in this period.

Setting the Context

Even before the current downturn, most would agree—and the data shows—that there is a significant amount of volatility in the cryptocurrency market. The initial S&P Cryptocurrency Indices, as reported in our whitepaper and based on back-tested data, have frequently experienced high annualized returns, accompanied by significant volatility and downside risk (see charts on pages 15-16 of the whitepaper.)

When we look at the S&P Bitcoin Index specifically, we can see that the two largest drawdowns since inception were 76% and 71%. The first one started in late 2017 and lasted more than a year. The second one dates back to 2014 and also lasted more than a year. (Drawdowns are within the back-tested history of the index, starting Jan. 1, 2014). The third largest drawdown was 40%, significantly less than the two largest and also more recent, in 2021 (see Exhibit 1).

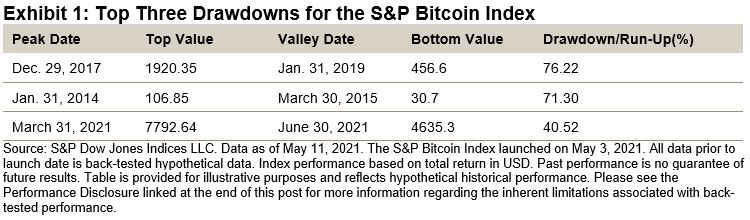
If we compare these drawdowns with the most recent period of decline (from March 28, 2022, to May 11, 2022), the drawdown was 39%. In other words, the current market drop is competing for third place in the list of largest historical drawdowns of the S&P Bitcoin Index on our record.

In times of significant market declines, it is particularly helpful to view the recent market environment in the context of earlier drawdowns. In the current case, the context shows that the asset class has been through worse conditions. For those who have started following cryptocurrency more recently, there is a term “crypto winter,” which describes past sharp declines in price followed by a period of little growth. Whether the market will head into winter or rebound remains to be seen.

Performance of the Broader Cryptocurrency Market

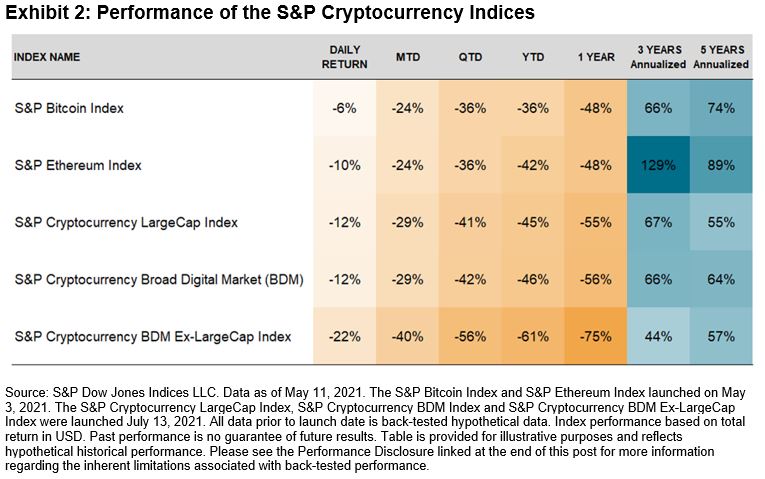
Looking at the S&P Cryptocurrency Indices overall, we can see that performance has varied based on market cap YTD.

In general, the coin-related indices with the largest market cap have experienced relatively smaller declines (see Exhibit 2). Specifically, the S&P Bitcoin Index and S&P Ethereum Index have fared better than the other broad indices. Whether this weathering is a function purely of market cap, or also due to the fact that these are the oldest, most liquid coins, is not easy to parse.

As we move down the cap table, we can see the worst-performing index YTD was the S&P Cryptocurrency BDM Ex-LargeCap Index. This index includes over 350 smaller coins and does not include the potentially stabilizing influence of Bitcoin or Ethereum. This performance too suggests that the market has historically favored the large-cap coins over small-cap coins.

Finally, it’s worth noting that S&P DJI does not include stablecoins or any other pegged digital assets in our existing cryptocurrency indices. This exclusion is because, while stablecoins may be considered an essential part of the cryptocurrency ecosystem, they do not necessarily reflect growth (or declines) in the market.

The recent events with stablecoin UST (TerraUSD) and its companion Luna, however, show that stablecoins can lose their peg, decline rapidly in the market and create systemic risk to crypto market stability overall.1

For more information about the S&P Cryptocurrency Indices, please see here.


1 https://www.nytimes.com/2022/05/12/technology/cryptocurrencies-crash-bitcoin.html

The posts on this blog are opinions, not advice. Please read our Disclaimers.

A Practical Look at Index Liquidity in Asia

What role does index liquidity play in helping market-participants in Asia participate in the U.S. equity ecosystem during Asia’s trading hours? Join S&P DJI and State Street Global Advisors for a practical look at using indices to assess the potential opportunity set.

Learn more: Regional Relevancy of S&P 500 and Dow Jones Industrial Average Futures in Asia – Education | S&P Dow Jones Indices (spglobal.com)

The posts on this blog are opinions, not advice. Please read our Disclaimers.

S&P 500 Weekly Options Now Expire Five Days a Week

Contributor Image
Berlinda Liu

Former Director, Multi-Asset Indices

S&P Dow Jones Indices

Since their debut in 1983, S&P 500 options have grown into the most liquid index options in the market today.1 In 2005, Cboe introduced PM-settled S&P 500 weekly options (SPXW) to meet market demand for additional trading frequency. The first weekly options expired only on Fridays, with Monday and Wednesday expirations added over time. On April 18 and May 11, 2022, respectively, Tuesday and Thursday expirations were added to complete the suite. Now SPXW options have five expirations a week.

Adding Tuesday and Thursday expirations reflects the increasing popularity of SPXW options. S&P 500 option trading has grown significantly in recent years; in the first quarter of 2022, S&P 500 option average daily trading volume (ADTV) exceeded 1.7 million, five times higher than that of 2005 (~285,000). Of that, SPXW option ADTV topped 1.2 million, about 70% of the total. Among the weeklies, roughly 45% ADTV expires on Fridays, 46% is split between Monday and Wednesday expirations, and the remaining 9% expires on Tuesdays or Thursdays because of holidays and end-of-month expirations.

Adding more expirations will offer more trading flexibility. Demand for short-term expirations has grown drastically since 2020. A Cboe study2 showed that in 2021, almost half of trading volume came from options that expired within five business days. Day trading and ultra-short-term option trading have broadly gained popularity. Whether the goal is to adjust exposure to imminent events or target specific risk/return objectives, more expirations allow more precise positioning.

Ultra-short-term options also come handy in option trading strategies. For example, in a calendar spread, a market participant expresses their view through a long position in a longer-dated option and sells a nearer-dated option to finance it. Ultra-short-term options tend to be less noisy compared with longer-term ones, due to their limited time frame. Therefore, participants implementing spread trade may benefit from the increased selection of ultra-short option expirations.

Since its introduction in mid-April, the ADTV of Tuesday-expired SPXW options increased to 211,714 in the first week of May, catching up the ADTV of Monday-expired (303,191) and Wednesday-expired (261,523) options. Five expirations per week is exciting news for market participants and could boost the S&P 500 options trading to a new level.


1 Cboe. “Cboe Global Markets Monthly Trading Statistics.” https://www.cboe.com/us/options/market_statistics/monthly_volume_rpc_reports/.

2 Cboe. “Trading SPXW Options with Expirations Five Days a Week.” April 20, 2022.

The posts on this blog are opinions, not advice. Please read our Disclaimers.

Transparency, Independence and Integrity as the Bedrocks of Indexing

Contributor Image
Dan Draper

Chief Executive Officer

S&P Dow Jones Indices

I am deeply honored to assume the chairmanship of the Index Industry Association (IIA) this year. Since 2012, the IIA has been a tireless advocate for independent index providers globally. As the IIA celebrates its 10th anniversary this year, now more than ever, our role in educating people about how indexing has transformed and democratized access to financial markets is crucial.

Indeed, indexing has rapidly evolved over the past three decades, growing from a relatively niche and obscure segment of the global financial market into a mainstream part of investing, retirement saving and generational wealth-building.

Today, global index providers collectively offer roughly three million indices that track and measure the broader markets as well as more targeted market sectors and segments. This means that overall, the indexing industry is ripe for competition and innovation.

Transparency has been a founding principle of the IIA, with its members committing to making index methodologies publicly available. Thanks to transparency and independent indices, there are more data and insights available today to help us better understand and evaluate market risks, returns and opportunities. Indices help investors make informed decisions to meet a wide range of financial goals.

Indices themselves have been around for a long time. Iconic gauges such as the Dow Jones Industrial Average® (DJIA), the S&P 500® and many other benchmarks are not only tracking the market’s daily ups and downs but are also reflecting its most pivotal moments. For example, indices have borne witness to the changing fortunes of the corporate world, industry shifts in the global economy and the rise of new companies. Indices reflect the market’s history and longevity and provide an eye toward its future.

The value and benefits that indices and indexing have brought to global markets cannot be underestimated. While independent index providers do not manage money, trade or develop investment strategies, indices are licensed and utilized as building blocks for index-based financial products such as exchange-traded funds (ETFs). The demand for indices and index-based products such as ETFs continues to grow, driven by their transparency, efficiency and low cost.

An S&P Dow Jones Indices study illustrated the strength of savings derived from indexing over the past 25 years. S&P DJI estimated that indexing has generated approximately USD 357 billion in cumulative savings in management fees. This study used three of S&P DJI’s core U.S. equity indices as a sample. If we consider the cumulative benefits derived from all the indices available linked to ETFs and other index-based investment products, the aggregate amount of savings would likely be far higher.

In addition to lower costs, performance is another key driver of the growth of indexing and the shift to index-based or passive investing from active management. S&P DJI has been tracking the performance of actively managed funds versus their respective indices and has found that active managers, which typically charge higher management fees, tend to trail their benchmarks in terms of performance. In the SPIVA® U.S. Year-End 2021 Scorecard, S&P DJI found that more than 80% of U.S. large-cap funds underperformed the S&P 500 over a 10-year period. Indices and indexing with their cost benefits have contributed to increased market competition. Ultimately, it seems that healthy competition among index providers and a diversity of choice benefit end investors.

Indices and the indexing industry as a whole will continue to reflect the ongoing evolution of global financial markets. Since its founding a decade ago, the IIA has served as a unified voice for the indexing industry and remains committed to maintaining an open and constructive dialogue with a diverse group of market participants and stakeholders.

The IIA and its members recognize their important contributions to and role in the broader financial ecosystem and will continue to uphold the highest standards of integrity and transparency in our industry to promote sustainable global financial markets and foster healthy competition and innovation.

This article was first published on the Index Industry Association website on March 31, 2022, as part of the series Voices of IIA.

The posts on this blog are opinions, not advice. Please read our Disclaimers.

Value Resurgent, Part 2

Contributor Image
Craig Lazzara

Former Managing Director, Index Investment Strategy

S&P Dow Jones Indices

The years between 2017 and 2021 were a frustrating half-decade for value investors. The S&P 500 Growth Index advanced at a compound annual rate of 24.1%, more than double the 11.9% return of its Value counterpart. Despite occasional (and sometimes prematurely celebrated) periods of success, Value underperformed Growth in four years of the five (and its win in 2019 was close).

In the first four months of 2022, however, the style winds shifted, as Value (-5.0%) dramatically outperformed Growth (-20.0%). Exhibit 1 puts this difference in historical context, comparing January-April 2022 to all other trailing four-month intervals in our database. The 15% gap between Value and Growth is obviously high by historical standards, and represents a dramatic reversal from recent trends. (As recently as nine months ago, the gap favored Growth by more than 10%.)

Exhibit 2 examines the same data with a 12-month lookback. The acceleration of Value’s performance is nearly as impressive from this perspective. At the end of April 2022, Value was 6.5% ahead of Growth; just five months ago, for the year ending November 2021, Growth was 13.3% ahead of Value.

For either lookback period, the conclusions are clear: Value has outperformed Growth to a historically uncommon degree, and this differential has accelerated quite dramatically in the last year.

What does this portend for the future relative performance of Value and Growth?  Spoiler alert: I don’t really know, but there are at least some reasons to suspect that Value’s advantage may weaken in the near term.  Exhibit 3 compares the current Value-Growth spread to its historical level.

Value’s 15% differential for the first four months of 2022 was not only visibly above average, it’s at the 98th percentile of all such spreads in our historical data. The only higher readings came in the deflation of the technology bubble more than 20 years ago. Comparing Pure Value and Pure Growth produces much the same result. The trailing 12-month data suggest a similar, if somewhat less extreme, conclusion, with Value’s outperformance just into the top quartile of its history. (Similar analysis for mid- and small-cap style indices show much the same results.)

The fact that a data point is high in its historical distribution doesn’t mean that next month’s observation can’t be equally high, or higher. There’s no guarantee, for that matter, that the distribution is stable, and that the next observation won’t surpass the previous all-time record. That said, history suggests that the torrid outperformance of Value is unlikely to continue, at least in the short term, and that the next big move in the Value-Growth differential is more likely to be down than up.

The posts on this blog are opinions, not advice. Please read our Disclaimers.