Get Indexology® Blog updates via email.

In This List

Crypto versus Gold – The Store of Value Debate

Using Index Icons to Track Potential Equity Opportunities

Indexing to Stay in Front of the Futures Curve

Risk Parity 2.0 Performance Review

Boston Marathon Can Teach Us about the S&P 500 ESG Index Methodology

Crypto versus Gold – The Store of Value Debate

Contributor Image
Jim Wiederhold

Former Director, Commodities and Real Assets

S&P Dow Jones Indices

In a blog post from earlier this year, I outlined comparisons between Bitcoin and gold. In this post, we’ll look at how the underlying investment theses for each asset have rapidly evolved this year. Prior to 2021, some market participants viewed Bitcoin as a form of digital gold, sharing many of the same use cases, such as being a store of value. Others viewed Bitcoin as a mechanism for exchange or a technological platform. Today, cryptocurrencies have crossed the chasm into the mainstream investment universe and are starting to compete with gold and other asset classes for a slice of the investment portfolio. Correlation turned negative this year as cryptocurrency volatility exploded while gold eased.

During the recent multi-month period of price consolidation for the largest market cap cryptocurrencies, the store of value thesis for holding cryptocurrencies seemed to be gaining prominence. Gary Gensler, the SEC chairman, said, “Bitcoin…is a highly speculative asset, but it is a store of value that people wish to invest in as some would invest in gold.”1 Institutional adoption continues at pace, albeit within a difficult regulatory environment, adding to the stable demand story needed in order for an asset to be considered a reliable store of value. Transparency increased in 2021 as S&P DJI launched its first cryptocurrency indices.

Concerns about inflation eroding purchasing power have led market participants toward liquid, scarce assets, which tend to hold value over time. Recent performance shows cryptocurrencies performed stronger than all other commonly considered stores of value, albeit with much higher volatility. Volatility may still be high for cryptocurrencies as they adjust to the competing forces of potential regulation news from governments and continued widespread adoption.

Recent debt ceiling discussions in the U.S. opened up the possibility, however small, of default by the country with the widely accepted risk-free rate of return (i.e., U.S. treasury yield). A decade of quantitative easing has arguably devalued assets, including the U.S. dollar. Where can market participants park wealth that won’t lose value over time? Gold, real estate, inflation-protected securities, or alternative assets such as art were the typical answers, but as people become more and more educated on cryptocurrencies, it seems reasonable to assume that they will join the list of assets used as a store of value. According to Fidelity’s latest Institutional Investor Digital Assets Study,2 52% of investors surveyed globally between December 2020 and April 2021 have an investment in digital assets. Asian investors were the most accepting of digital assets, with more than 70% holding exposure.

Alternative investments are becoming increasingly popular as investors look outside the traditional equity and fixed income markets for assets that can provide a good store of value as well as diversification benefits. Inflated asset and real estate prices are driving a closer examination of places to store wealth that will hold value over time. Cryptocurrencies may be viewed as the higher beta store of value as this new asset class coalesces and it could one day be considered a normal allocation to a standard portfolio, similar to gold.


1 Gary Gensler U.S. SEC Chairman, Oct. 6 2021, House Financial Services Committee oversight hearing.

2 Fidelity Digital Assets, September 2021, The Institutional Investor Digital Assets Study.

The posts on this blog are opinions, not advice. Please read our Disclaimers.

Using Index Icons to Track Potential Equity Opportunities

How are investors using the S&P 500 and DJIA to measure and assess potential opportunities in U.S. equities? Garrett Glawe and Jason Ye of S&P DJI join Michele Barlow of State Street Global Advisors to explore how investors are putting these index icons to work in Asia.


Learn more: https://www.spglobal.com/spdji/en/education/article/comparing-iconic-indices-the-sp-500-and-djia/

The posts on this blog are opinions, not advice. Please read our Disclaimers.

Indexing to Stay in Front of the Futures Curve

How could a dynamic approach to index design help market participants address negative roll yields and volatility concerns? S&P DJI’s Jim Wiederhold and Kelsey Stokes join BlackRock’s Chris Milliken for a closer look at the S&P GSCI Dynamic Roll.

The posts on this blog are opinions, not advice. Please read our Disclaimers.

Risk Parity 2.0 Performance Review

Contributor Image
Berlinda Liu

Former Director, Multi-Asset Indices

S&P Dow Jones Indices

In our two previous blogs on risk parity 2.0 (see here and here), we covered the philosophy and methodological differences between the original S&P Risk Parity Indices and the newly launched S&P Risk Parity 2.0 Indices. This third and final installment of this series now looks at the performance and attribution statistics of the S&P Risk Parity 2.0 Indices, specifically the S&P Risk Parity 2.0 Index – 10% Target Volatility.

As Exhibits 1 and 2 show, the performance of the S&P Risk Parity 2.0 methodology compares favorably to that of the original risk parity indices and significantly outperformed actively managed funds, as measured by the HFR Risk Parity Vol 10 Institutional Index.

The last decade and a half have had no shortage of interesting market events, as the 36-month realized volatility graph in Exhibit 3 underscores. The onset of the Global Financial Crisis in September-October 2008 showed a spike in volatility initially, but then largely flattened out (dropping closer to the “target” as the 36-month window rolls off). Realized volatility stayed in a downtrend for much of the ensuing decade, before once again moving higher during the pandemic.

Drawdown periods and performance were similar across the indices. While the S&P Risk Parity 2.0 Index performed better in Q4 2018 and March 2020 than the other indices, it lagged slightly during the Global Financial Crisis.

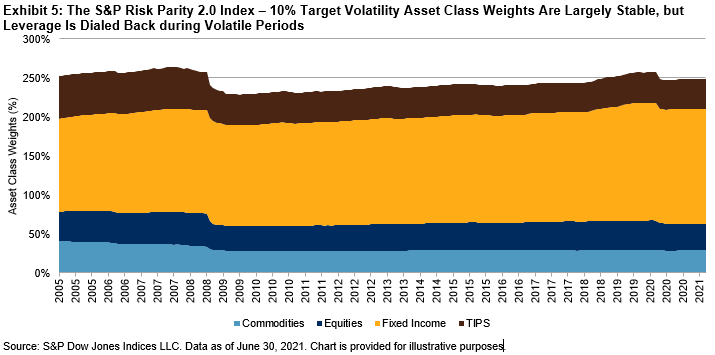
As expected, leverage for the S&P Risk Parity 2.0 Index dropped during these periods of volatility. Leverage reached the life-to-date max of 263.9% in November 2007, before falling to the lifetime low of 228.7% in August 2009. After slowly growing over the next decade, it reached a high of 257.5% before the start of the COVID-19 pandemic, and subsequently retreated ~10% over the next few months.

Exhibit 5 shows these leverage drops and the allocated asset class weights over time. The relative commodities and Treasury inflation-protected securities (TIPS) notional allocation have slightly but steadily decreased since inception, with that weight largely being reallocated to fixed income.

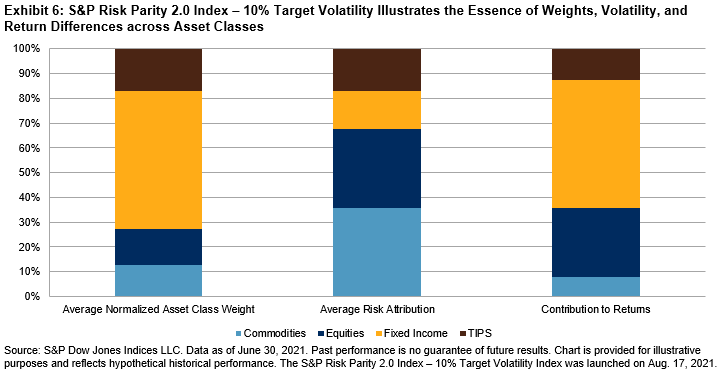
Finally, the core of risk parity is neatly displayed in Exhibit 6. While the notional asset allocation is dominated by fixed income, the lower volatility of that asset class translates into a far smaller risk attribution. On the other hand, commodities necessitate a far smaller notional share to satisfy its allocated risk budget. Following the largely downward trend of interest rates globally during this period, fixed income provided the lion’s share of returns, with equities in second place. TIPS, by nature a hybrid instrument that reflects interest rates and inflation/growth expectations, were largely stable across all three metrics.

The posts on this blog are opinions, not advice. Please read our Disclaimers.

Boston Marathon Can Teach Us about the S&P 500 ESG Index Methodology

Contributor Image
Raymond McConville

Former Communications, Americas

S&P Dow Jones Indices

Today is the 125th Boston Marathon—a big day in the world of distance running. Organized by the Boston Athletic Association (BAA), it is perhaps the pre-eminent annual event on the global marathon calendar. The 20,000 runners in today’s race were selected in May 2021, around the same time S&P DJI rebalanced the constituents of the S&P 500® ESG Index. What does one have to do with the other? More than you’d think.

The way S&P DJI and the BAA determine eligibility and eventual selection for these two fields of competitors is strikingly similar. They both start with an overall universe of candidates, apply a transparent rules-based screening process to determine eligibility, and compare potential constituents to their peers in a math-based selection process.

The Objective

The S&P 500 ESG Index is designed to measure securities from the S&P 500 that meet sustainability criteria while maintaining similar overall industry group weights as the underlying index.

The Boston Marathon comprises a field of marathoners that is faster than the broader universe of runners but is still reflective of the overall runner population. It achieves this by maintaining similar gender and age group diversity to the applicant field.

The Eligibility Universe

To be included in an index or a marathon, one must first be eligible. Both begin with a broad universe of constituents and whittle things down from there. For the S&P 500 ESG Index, that universe is the S&P 500. For the Boston Marathon, it’s all runners who have completed a certified marathon in the 12 months before the application period. Both are broad but already impressive fields.

The Screening Process

S&P DJI first eliminates companies involved with certain business activities, companies with disqualifying UN Global Compact Scores, and companies with ESG scores in the bottom 25% of their Global GICS® industry group. The remaining companies form the S&P 500 ESG Index eligibility universe.

The BAA eliminates runners who do not meet the time qualifying standards, which vary depending on the runner’s age and gender. All runners who meet their respective qualifying times are eligible for the Boston Marathon.

The Selection

Here’s where the S&P 500 ESG Index and Boston Marathon methodologies become eerily similar. In both cases, just because you meet the eligibility criteria does not mean you are ultimately selected for inclusion.

S&P DJI goes through each GICS industry group and selects the highest-performing companies by ESG score until as close to 75% of the group’s market cap is reached. Once complete, the S&P 500 ESG Index is formed.

The BAA goes through each gender’s age group and selects the fastest applicants first until the entry limit for each group is reached. Once complete, the field of Boston Marathon runners is set.

It’s All Relative

The common theme between the S&P 500 ESG Index and the Boston Marathon selection processes is the way eligible constituents are ranked against their peers. For the index, it’s not how high your ESG score is, but how high your ESG score is within your industry group. And for the Boston Marathon, it’s not how fast you are, but how fast you are relative to your gender and age group peers.

That’s why it’s difficult to predict each year which companies will make it into the S&P 500 ESG Index and which runners will get to run the Boston Marathon. Every year the scores and finish times are different—we don’t know who makes the cut until we can compare everyone.

Rising Standards

As distance running has surged in popularity, it has become increasingly difficult to get into the Boston Marathon. The race has served as a proverbial carrot that encourages runners to train harder, and the result has been faster entry times and higher qualifying standards.

ESG investing is also surging in popularity, as market participants across the globe are increasingly prioritizing investments that align with their values. This, in turn, has had the desirable effect of increased engagement from companies through greater transparency and implementation of sustainable business practices. Benchmarks such as the S&P 500 ESG Index look to further encourage this trend and make the competition for inclusion tougher each year, as companies increase their ESG adoption.

The posts on this blog are opinions, not advice. Please read our Disclaimers.